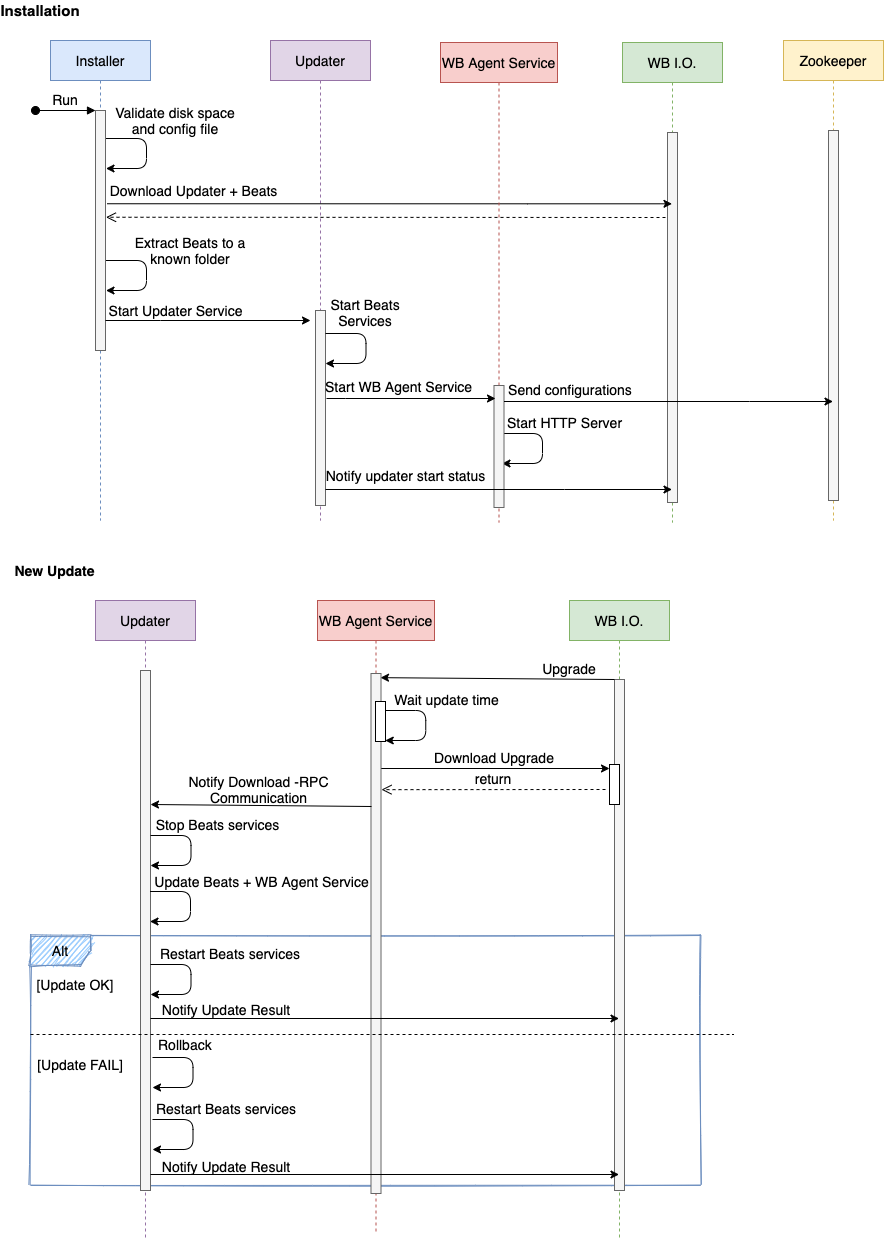
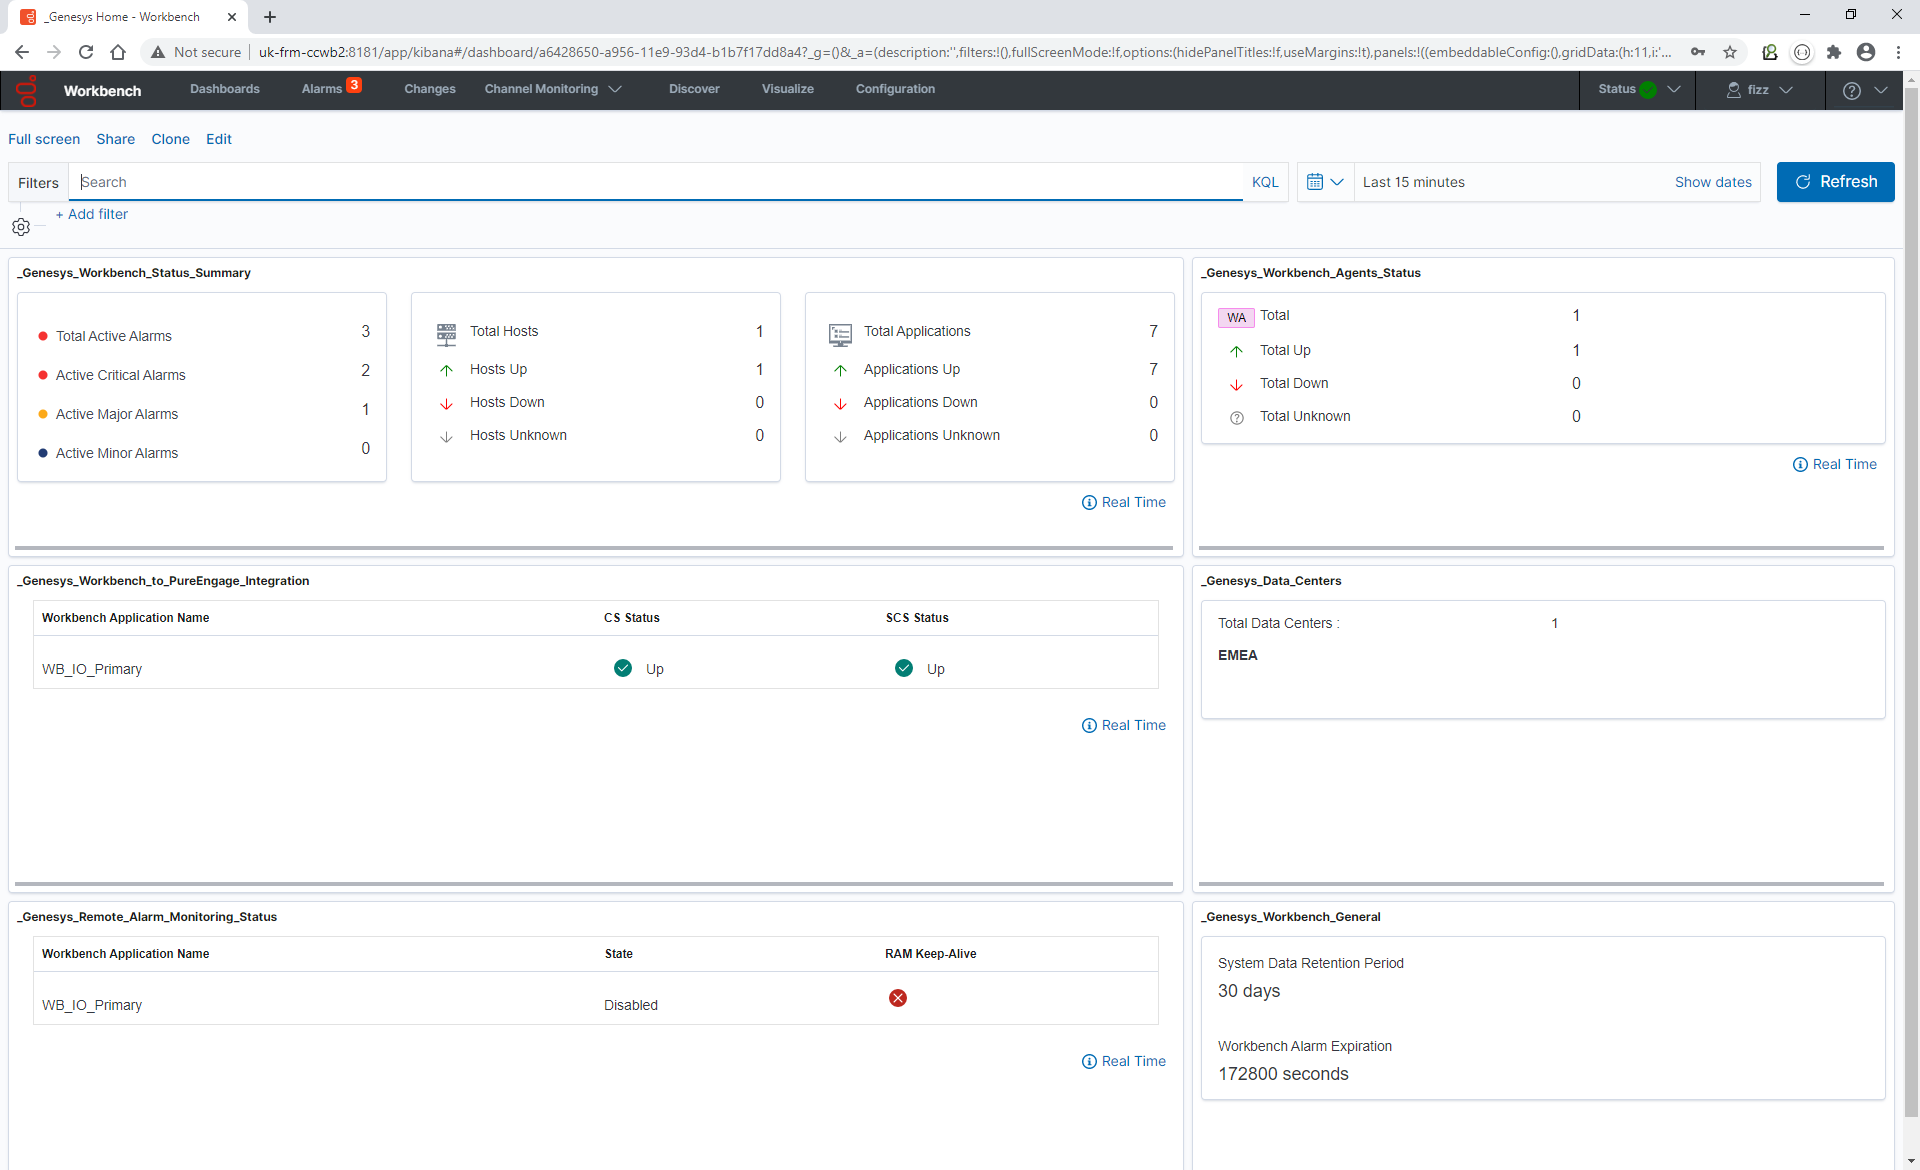
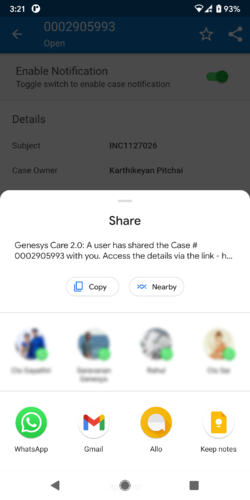
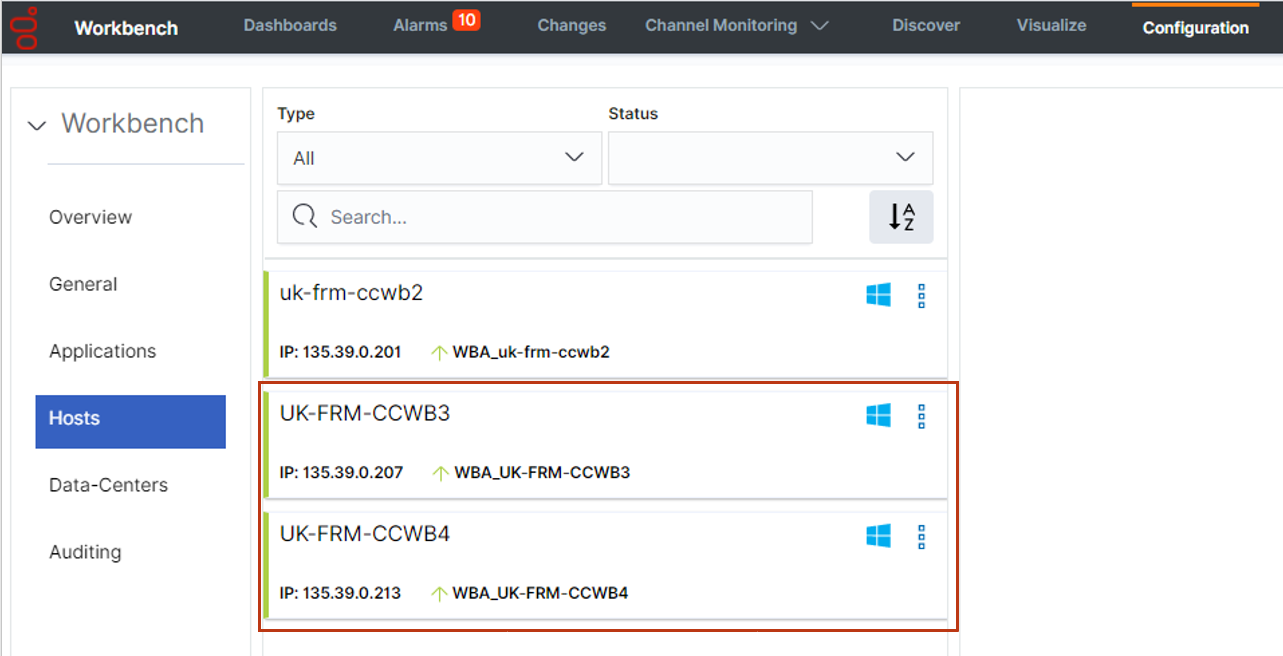
Apps & Tools Articles

When a customer experiences a call spike, or the utilization of other resources hits one of our thresholds, like memory usage, we can deploy more Cloud Edges into their environment via automation. Imagine if your computer was bogged down because of all of those pivot tables you’re working on, and you could tap the power of a second computer automatically.

If your customer has Cloud Edges and they know they expect increased call volumes starting on a particular day, they can also open a proactive case with Product Support, and their environment can be ready for that spike in advance. Just give Product Support notice a week in advance, and we can help!

When an environment needs to be scaled up, Genesys Cloud tooling adds another 50% of the current Edge count (so if the customer has 8 Edges, we add another 4 Edges), and balance across those. If that isn’t enough, we evaluate and add another 6 Edges, and so on, until the spike is over. The environment is then scaled back down gracefully, after their spike is over, too. 

Prerequisites

  1. A pairing link sent by Genesys Cloud support.
  2. The following permissions:
    • Authorization > Org Trustor > All
    • Authorization > Org Trustor > View
    • Authorization > Org Trustee Group > Add
    • Authorization > Org Trustee Group > View
    • Authorization > Role > View

To access your Cloud organization, the Genesys Cloud Customer Care team may ask to pair their Genesys Cloud Customer Care Support Team organization to your organization.

NOTE: You can control their access to your organization by assigning roles, and you can revoke their access at any time.

Pair your organization with Customer Care organization

  1. Log in to your Cloud organization.
  2. To access the pairing request page, open the pairing link sent by Genesys Cloud Customer Care.
    • NOTE: The pairing link expires after seven days, and you can use it only one time. If your link expired, ask your Customer Care representative for a new one.
  3. From the pairing request page, click Yes, I authorize access.
  4. Click the Groups tab.
  5. Assign roles to the Genesys Cloud Customer Care Support Team group by selecting roles in the Role(s) column.
  6. Support recommends that you either assign every role to their group or create a new role with all permissions and assign it their group.
    • NOTE: Genesys Cloud does not bill your organization for the roles or licenses used by Customer Care.

Additional resources

Use this style guide to help standardize the content of your knowledge article. 

Sentence case 

"Clear the cache of the Google Chrome browser" 

All article headers should be in sentence case. 

Sentence case is when the first letter in the first word of a heading and any proper nouns are capitalized. 

Headings 

Logical heading structure helps readers understand the outline of a page’s content. Headings help readers find and keep their place, especially in longer articles.  

Headings are also important for people who use screen reader software to access text they cannot see. A common feature in most screen readers brings up a list of all headings on a page. The readers can then use that list to navigate through the page and drill down to the content they want to listen to. 

Best practices when using headings 

  • Use headings and subheadings to describe the content that follows in logical chunks. 
  • Headings should always be nested, consecutive, and formatted using heading levels <h2> through <h4>. When creating a new subheading, don’t skip heading levels. 
  • Avoid excessive nesting. For example, limit most content to heading levels <h2> through <h4>. 
  • You must use the Paragraph Format tool when creating headings. Do not use the font and font size tools independently to create a heading because then your headings will be imperceptible to people using screen reading software. 
  • Avoid heading-only content. 

Keywords, tags, and meta entries 

Keywords, tags, or meta entries should be entered as singular words or terms separated by commas. If a word appears in the title or body of an article, it does not need to be repeated as a keyword, tag, or meta entry. 

Abbreviations 

Abbreviations are acceptable if they are spelled out upon first use (e.g., escalate the incident to Customer Care Operations (CC Ops)). 

Boldface type 

Use bolding only for names of buttons and fields or for critical path items. For example: 

  • In File Explorer, go to:  
    • C:/readers/%username%/  
  • Click the Save to XML button. 

Italics and underlined text  

Avoid using italics or underlining words and phrases. Hyperlinks should be the only underlined text in knowledge articles.  

Quotations  

Quotation marks should only be used around words that people have said, or to denote that a particular text is being quoted.  

Dates and times  

Use the MM/DD/YYYY format (e.g., 10 June 1977 would be 06/10/1977).   

Use the HH:MM AM/PM Time Zone format (e.g., 3pm CST would be 03:00 PM US Central).  

Lists  

  • Use bullets for lists when order does not matter. Use numbered lists for procedural steps where order is important and there is more than one step.  
  • All lists, bulleted and numbered, should be structured as a list with the proper HTML tags. 
  • Use concise bullet points instead of long or compound sentences. 

Tables 

  • Don’t use a table when the same information can easily be presented in a list. Lists are more responsive to screen size and ratio changes. 
  • Include a title and a summary or table overview preceding the table. Screen readers use this information to describe the table for visually impaired readers. 
  • Ensure the header row or column and all header cells contain content. Empty header cells cause problems for readers relying upon a screen reader. 
  • Feature a single idea or piece of data per cell. Cells that contain a combination of different data types or ideas cause problems for readers relying upon a screen reader. 
  • Ensure cells do not span rows or columns. Merged cells cause problems for readers relying upon a screen reader. 
  • Whenever possible, define cell widths in percentages (%) and not as absolute pixel widths. This can help reduce issues when tables are displayed on smaller screens.
  • Avoid defining cell heights. Defining absolute cell heights can result in content being truncated when readers zoom in to make content larger. 

Input instructions  

  • Click, double-click, right-click: Use when referring to on-screen buttons (Click OK, right-click the Submit button).  
  • Choose: Use when picking an option from a menu or list. (Choose File from the dropdown.)  
  • Press: Refers to depressing a key on a physical keyboard. (Press Enter.)  
  • Select: Once something (a block of text, a cell in Excel) is selected, it stays selected. To undo this, it must be deselected.  
  • Tap: Use when referring to a touchscreen device such as an iPad. (Tap the Settings app.)  

File paths 

File paths should be in boldface type in a separate bulleted line to ensure accurate copying, for example: 

  1. In File Explorer
    • go to: C:/readers/%username%/  

Cautions  

Caution statements are warnings that appear in the body of articles and should be typed in red using capital letters (e.g., CAUTION: Rebooting the system at this time will result in loss of data.).  

Notes  

Notes are information that supplement a solution and should be typed in orange using capital letters (e.g., NOTE: Some Android devices and versions have different icons, labels, and paths than those described here.).  

Key combinations  

Use the plus sign (+) if keys must be pressed at the same time (e.g.,Press Ctrl+Alt+Del). Use commas for key sequences (e.g., Press Alt, F, then X).  

Numbers  

Use numerals (1, 52, 367) and commas for values above 1,000.  

Multimedia  

Hyperlinks  

Hyperlinks are typically used to refer readers to related articles in the knowledge base, documents, home pages, and external websites.  

  • Hyperlinks should always open new tabs. 
  • Because screen reader readers often choose to list the links on a web page, clearly and uniquely describe each link target.  
    • Describe the link destination instead of providing the actual web address. The letters, numbers, and symbols in a typical URL are not helpful for screen reader readers. 
    • Avoid vague phrases, such as Learn more or Go here, which give no context for people who access links from a list. 
    • Verify that there are no duplicate link labels on a page, unless you are intentionally sourcing link labels that refer to the same destination. 
  • If a link is going to an external domain, use an external link icon arrow pointing outside of a container  to indicate that to the readers and specify alt=“opens in new window”. 
  • For links that open in a new tab or window, let the reader know. One way to do this is to use link text such as: “XYZ link name [link opens in a new tab]”. 
  • URLS should be in a separate bulleted line, for example: 
    1. In a browser, navigate to: 

Videos  

Videos can be embedded in knowledge articles.  

  • Recommended size: Width – 480 px / Height – 360 px  
  • Avoid any animations that flash or blink more than 3 times per second. Otherwise, rapidly blinking animations can cause seizures in some readers. 
  • Any animations that last longer or repeat for longer than 5 seconds must include a way to pause or stop the animation 

Images  

Images should not exceed the size of the KB window (recommended size: Width – 480 px / Height – 360 px or smaller). Alterations to images should be made using an editing tool (e.g., SnagIt, Microsoft Paint). Acceptable graphic formats for knowledge base articles: .jpg, .jpeg, .png  

Alternative Text (Alt Text) 

  • Required for all images. 
  • Alt text should always be 100 characters or less. If you need more space, move some of the content to Descriptive text for the image. 
  • Should contain a brief description of the meaning or purpose of the image. 
  • Relevant information depends heavily on the image’s context. 
  • Write alt text and descriptive text when you write the content that surrounds the image. Alt text written after the initial content is drafted is usually less complete and effective. You might not remember why you included an image or details about that image. 

Descriptive text 

  • Required when the information that must be conveyed exceeds the recommended alt text limit. 
  • Provides a summary the image and describes the data provided in the image as it applies to the context surrounding it. 
  • If you include a chart or graph, the alt text summarizes the main theme of the data shown, and the descriptive text provides details about the data. To understand what information to convey about the image, think about why the image is being included. 
  • For more complex images, such as diagrams, charts, and infographic information, provide as much information as possible in the descriptive text surrounding the image, not in the alt text. Describe the information, properties of the information, and how different pieces of information relate to each other. Whenever possible, use a table or list to describe the data that the chart or infographic conveys. Then use the alt text to note that the image corresponds to the descriptive text, for example:  
  • alt=“Corresponding chart of information”. 
  • The combination of alt text and descriptive text must be an effective summary of the meaning of an image, so that nothing is lost for readers with impairments or readers who have turned off images. All readers must be able to get the same information from the alt text and surrounding text as if they could see the image. 

Attachments  

Acceptable formats for attachments include .jpg, .jpeg, .pdf, .png, and Office file types.  

Copying and pasting content from other sources 

Be sure to paste the content first into an application like Notepad, where any formatting is removed from the HTML source code, then paste it into the knowledge article. 

Additional training 

If you would like to learn more about the new Escalation Management Process, you can access our training at: 

Check Multicloud CX operational health, system availability, incident and outage information using the links below.

NOTE: Use the Subscribe to Updates button in the top-right to subscribe to receive emails, SMS, RSS, or Atom feed updates.

Prerequisites

The following permissions:

  • Architect > Flow > Add
  • Architect > Flow > Edit
  • Architect > Flow > View

When you add a new flow, consider the following:

  • The maximum length of a flow name is 200 characters.
  • Newly created flows may take a few seconds to appear. Because authors typically begin configuring the flow immediately, this delay may go unnoticed. To update the current list, click the Refresh button on the Architect Home page.
  • You can select a default language from the current list of support TTS languages. However, if the language you want to use with prompts is not listed, you can change the flow to any language. For more information, see Languages and runtime data playback.
  • You cannot duplicate names for flows or prompts of the same type, but you can use the same name across types. For example, you can use the name "Main" for one inbound flow and one outbound flow, but not two inbound flows. 

Note: For first-time flow creation, Architect selects the default language set for your organization. In the Create Flow dialog box, when you select a default language that differs from the organization's default language, Architect applies the alternate language only to the new flow.

Continue to the Resource Center page https://help.mypurecloud.com/articles/create-a-call-flow/ to begin creating a flow according to your company’s design. Learn about tips and best practices when designing a flow for Architect, then configure and publish the flow for use in routing.

Yes, Genesys supports customers’ need to perform automated testing but it does not permit unauthorized automated testing.

Genesys has established an Automated Testing Support program to help support our customers that need to perform automated testing in the most effective manner. This program includes best practices guidance for testing. The guidance is based on knowledge gained from our direct experience and prior customers’ tests, in addition to test reviews. If you need to perform automated testing, work with your Genesys or partner team to learn about the Automated Testing Support program and review process.

Genesys performs extensive testing on all of our products and features. We want customers to have confidence in both Genesys Cloud and all the elements associated with every interaction. These elements can include data action integrations to customers’ systems, call delivery via the customers’ network, and more. Genesys performs extensive load testing at twice the peak regional load as part of our normal process. Genesys internal load testing uses automated (synthetic) transactions with the same traffic characteristics and capabilities observed in the production environment. Traffic includes inbound calls, outbound calls, chats, messaging, and more. 

Genesys continuously monitors Genesys Cloud and customer traffic for anomalies in production environments. Genesys Cloud organizations are configured with specific limits designed to safeguard services from abusive and unexpected traffic patterns, encourage efficient use of billable resources, and protect customers from unexpected usage. These limits are detailed here. Unusual traffic can be caused by automated testing, unauthorized load testing, abusive access, or possibly misconfiguration. Such anomalies may be perceived as a Denial of Service (DoS) or other attack against Genesys Cloud or an end customer. This traffic can generate alarms, resulting in page notifications to Genesys personnel and end customer personnel for notification/visibility, and incur other costs. Genesys must be notified and authorize all automated testing in advance.


Cloud CX (formerly PureCloud) - Learn more

Multicloud CX (formerly Engage and PureEngage) - Learn more

Cloud DX (formerly Bold360) - Learn more

PureConnect - Learn more

Use these 12 helpful guidelines to ensure your article is easy to read and adheres to the document standards. 

Use the customer’s context

Capture enough information to make the issue distinct and usable. Record the issue or question in the customer’s words. This does not mean to capture bad grammar. It does mean to use the same keywords and phrases the customer uses. Use keywords that reflect the customers vocabulary (e.g., boards, KPS) and that are not already listed in the short description. 

Write with the audience in mind 

The solution must contain all the appropriate guidance required by the target audience. Be clear and concise. Use terminology carefully. Provide the appropriate level of direction. Write to the customer as if you were talking to them over the phone. 

Don’t create duplicates 

Search the knowledge base to ensure that your contribution will not be a duplicate. Duplicates create inconsistencies. If a consumer finds more than one article on a particular issue, how will they know which one is correct? If a duplicate exists, it may indicate that the original article needs to be modified to enhance findability. Adding the new context of the consumer is usually required. 

Don’t reference the agent, customer, staff member, or case 

Focus on the issue and the solution (e.g., Reset a Genesys password, not An customer wants to reset their Genesys password). 

Number the steps 

Numbered steps are easy to follow and imply that the order is important. 

Keep product names proper 

Consistency is created when all articles are associated with the same product name. Cloud is not the same as Genesys Cloud, WIN10 is not the same as Windows 10. 

Use reasonably sized graphics 

Large files can negatively affect response time. Screenshots should focus on the region of interest and not the entire screen. Images should not exceed the size of the KB window. The recommended image size is 480 x 360 pixels or smaller. 

Make attachments visible 

Ensure that attachments are located on an accessible file server, and that the file is a supported file type (see the style guide).

Avoid abbreviations and acronyms 

Acronyms should only be used if they are defined on the first usage within an article or the acronym is a brand or is common to the audience. 

Always check spelling 

Many common spelling errors can be eliminated by using a spellchecker. 

Follow the style guide 

Articles should adhere to the standards detailed in the style guide. This ensures consistency, making articles easier to follow. 

Use correct hyperlinks 

Hyperlinks should point users to the intended URLs or documents and should open in a new tab. Links should not be dead or broken. 

Genesys Cloud telephony connection options provide convenience and flexibility. Simplify your implementation by using Genesys Cloud Voice, a comprehensive contact center solution that includes telephony service provided by Genesys. For additional interoperability between Genesys Cloud and third-party devices, or to retain your existing carrier service, choose a Bring Your Own Carrier (BYOC) option.

For more specific details on the features of each option, you can read this article in the Resource Center: https://help.mypurecloud.com/articles/telephony-connection-options/

Telephony is the set of features that administrators use to set up Genesys Cloud communications.  Genesys Cloud offers three telephony connection options to provide convenience and flexibility. Simplify your implementation by using Genesys Cloud Voice, a comprehensive contact center solution that includes telephony service provided by Genesys. For additional interoperability between Genesys Cloud and third-party devices, or to retain your existing carrier service, choose a Bring Your Own Carrier (BYOC) option.

General

General information related to the telephony topic.

Telephony connection options

Genesys Cloud telephony connection options provide convenience and flexibility.

Trunks

A trunk connects a communication service to a Genesys Cloud telephony connection option and facilitates point-to-point communication. 

Sites

A site is the home of a set of phones. The site defines the telephony properties, for example the country code or area code, for dialing in addition to the call classification rules and outbound routing rules. 

Phone management

Genesys Cloud manages a wide variety of SIP phones. Administrators set base settings for the phones or change the settings for individual phones using Genesys Cloud. 

Certificate Authorities

Authorized Services manages the digital certificate files issued by a Certificate Authority (CA). This process ensures the identification of a trusted authority through encryption.  

DID numbers

Administrators add a single DID number or a range of DID numbers associated with the organization’s service provider. You can also assign toll-free numbers.

Extensions

Administrators can add a single extension or a range of extension numbers associated with the organization. 

Genesys Engage Application Object Requirements

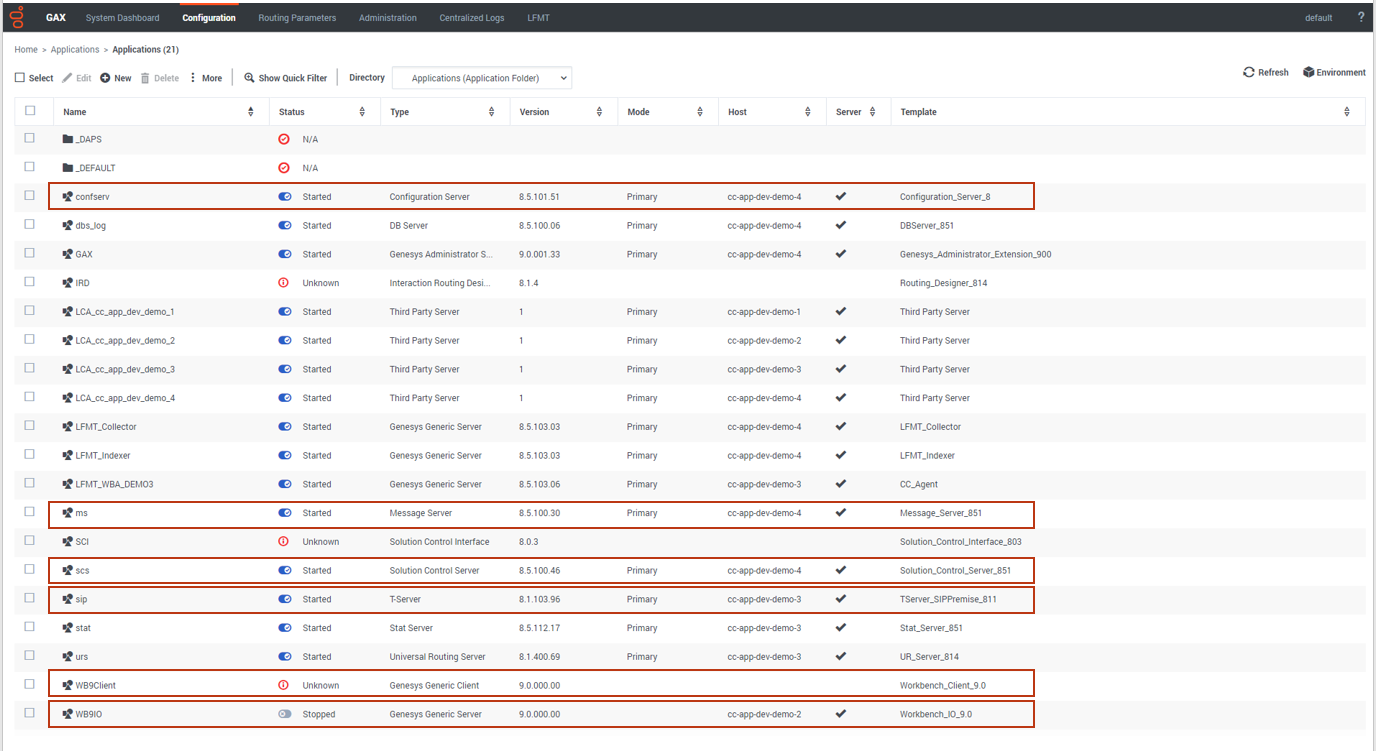
Workbench integrates to the Genesys Engage platform, as such the following Genesys Engage Objects will be required and leveraged by Workbench:

Component Description/Comments
Genesys Engage Workbench Client application/object enables Engage CME configured Users to log into Workbench
Genesys Engage Workbench IO (Server) application/object enables integration from Workbench to the Engage CS, SCS and MS
Genesys Engage Configuration Server application/object enables integration from Workbench to the Engage CS; authentication and Config Changes
Genesys Engage Solution Control Server application/object enables integration from Workbench to the Engage SCS; Alarms to WB from SCS
Genesys Engage Message Server application/object enables integration from Workbench to the Engage MS; Config change ChangedBy metadata
Genesys Engage SIP Server application/object (optional) enables integration from Workbench to the Engage SIP Server enabling the Channel Monitoring feature
*Workbench integrates to SIP Server only and not SIP Server Proxy

WARNING

  • Ensure each and every Engage CME Application has an assigned Template else the Workbench installation will fail.
  • Ensure Engage CME Hosts Objects have an IP address assigned else the Workbench installation will fail.

Example CME objects:

WB 9.1 CME Objects.png

Engage application configuration pre-installation steps

1. Import the installation package import using GAX

The following steps provide a guide to importing the mandatory GAX Workbench 9 Installation Package containing the Workbench 9 Templates and Applications configuration:

  1. Login into GAX.
  2. Navigate to Administration.
  3. Click New.
  4. Select the Installation Package Upload (includes templates) option.
  5. Click Next.
  6. Click Choose File.
  7. Browse to the extracted Workbench_9.x.xxx.xx_Pkg folder.
  8. Double-click into the templates folder.
  9. Double-click into the wb_9.x_gax_ip_template folder.
  10. Double-click the Workbench_9.x_GAX_Template_IP.zip file.
  11. Click Finish.
  12. Click Close when the import has successfully completed.

Example Workbench Installation Package:

WB 9.1 GAX Import Wizard.png

The procedure above will provide the:

IO and Client Templates:

WB 9.1 Template in CMEs.png

Workbench Admin Role:

WB 9.1 Template Role.png

2. Provision the IO (server) application using GAX

NOTE

  • For a successful Workbench installation/run-time, the System/User Account for the Workbench IO application must have Full Control permissions.
  • The "WB9IO" Application will have a dummy [temp] Section/KVP due to mandatory prerequisite packaging.

This Workbench IO (Server) Application is used by Workbench to integrate to Genesys Engage components such as Configuration Server.

  1. Log into GAX.
  2. Navigate to Configuration.
  3. In the Environment section, select Applications.
  4. In the Applications section, select New.
  5. In the New Properties pane, complete the following:
    1. If not already, select the General tab.
    2. In the Name field, enter an Workbench IO Application Name i.e. WB9IO.
    3. Click on the Template field and navigate and select the Workbench_IO_9.x.xxx.xx Template.
    4. In the Working Directory field, enter "..." (period character).
      1. Not explicitly required for Workbench 9, but a mandatory CME field.
    5. In the Command Line field, enter "..." (period character).
      1. Not explicitly required for Workbench 9, but a mandatory CME field.
    6. In the Host field, select the host where Workbench Primary will be installed.
    7. In the Connections tab, click the Add icon to establish connections to the following applications:
      • (Optional) The primary or proxy Configuration Server from which the configuration settings will be retrieved. This is only required if connecting to Configuration Server via TLS. See the Genesys Security Deployment Guide for further instructions. Note: The security certificates must be generated using the SHA-2 secure hash algorithm.
  6. Click Save to save the new application.

The Workbench IO (Server) Application (i.e. "WB9IO") configuration has now been completed; this enables Workbench to Genesys Engage integration both from an installation and run-time perspective.

Wb9 wb io app 1.png

NOTE

  • For a successful Workbench installation/run-time, the System/User Account for the Workbench IO application must have Full Control permissions.
  • The "WB9IO" Application will have a dummy [temp] Section/KVP due to mandatory prerequisite packaging.

3. Provision the client application using GAX

This Workbench Client Application is used by Workbench for Client Browser connections to Workbench, without it, no Users can log into Workbench.

  1. Log into GAX.
  2. Navigate to Configuration.
  3. In the Environment section, select Applications.
  4. In the Applications section, select New.
  5. In the New Properties pane, complete the following:
    1. If not already, select the General tab.
    2. In the Name field, enter an Workbench Client Application Name i.e. WB9Client.
    3. Click on the Template field and navigate and select the Workbench_Client_9.x.xxx.xx Template.
  6. Click Save to save the new application.

The Workbench Client (i.e. WB9Client) Application configuration has now been completed; this enables Users to login to Workbench.

Wb9 wb client app 1.png

NOTE: The "WB9IO" (Server) Application (or equivalent name) will have a dummy [temp] Section due to mandatory prerequisite packaging.

4. Provision the client role using GAX

  1. Log into GAX.
  2. Navigate to Configuration.
  3. In the Accounts section, select Roles.
  4. In the Roles section, select New.
  5. Select None in the drop down for Role Template.
  6. Click OK.
    1. If not already, select the General tab.
    2. In the Name field, enter a Workbench Administrator Role Name - i.e. "WB9_Admin".
    3. In the Description field, enter "When assigned to Users, grants access to the Workbench\Configuration Console."
    4. Select the Role Members tab.
    5. Add your relevant Access Group(s) and/or Person(s).
    6. Select the Assigned Privileges tab.
    7. Check the Workbench Admin Access checkbox.
  7. Click Save.
  8. The WB9_Admin Role has been created.
  9. Therefore, certain assigned Users, will now have visibility/access to the Workbench Configuration Console, enabling the Configuration of Workbench Applications, Settings and Features.

WB 9.1 GAX Import Wizard 2.png

An example of the "Super Administrators" Access Group being assigned the "WB9_Admin" Role:

WB 9.1 GAX Import Wizard 3.png

Wb9 admin access 1.png

Changes console ChangedBy field for Engage changes

For the ChangedBy field to be accurate (not "N/A"), the following configuration is required:

  • A connection from the respective Genesys Engage Configuration Server or Configuration Server Proxy to the Genesys Engage Message Server that Workbench is connected to.
  • If not already, standard=network added to the log section of the Configuration Server or Configuration Server Proxy that Workbench is connected to.

WB 9.1 CS to Ms connection for ChangedBy.png

WB 9.1 CS Log Network standard.png

PureCloud customers and partners should visit the PureCloud Resource Center and explore available education courses and webinars to learn about PureCloud features, support, apps, and billing information. 

Visit PureCloud Training to explore available education courses. If you are a PureCloud user and would like to open a case or view the status of a case, please return to the My Support login page and sign in. 

If you need information on how to use My Support including opening and managing cases, please reference the My Support Info Guide for PureCloud

The following information is outlined for Genesys Cloud only; not applicable to on-prem environments.

Considerations

The following considerations must be followed or the test may be declined:

  • Limits
  • Time of Day
    • 11pm - 5am regional Friday & Saturday are preferred, business justification must be provided if other times are listed
    • NO testing is allowed during peak regional hours (6am - 9pm)
  • Testing Results: Testing is considered experimental and the outcome of the test cannot be guaranteed
  • Testing Execution: Genesys Cloud does not perform testing on behalf of our clients (single tenant orgs), but have recommended partners in AppFoundry

Helpful resources 

How to request a production load test

NOTE: Steps do not guarantee the test will be approved. 

  1. Requests must be submitted a minimum of 2 weeks in advance.
  2. Complete the GenCloud Testing Form.
  3. Open a case with Product Support and provide the completed GenCloud Testing Form.

Genesys Cloud is a premiere platform for your telephony needs. To ensure that we can provide the best network connectivity worldwide, we have partnered with Amazon Web Services (AWS). Because of AWS’s worldwide reach, network connectivity between your Local Area Network (LAN) and Genesys Cloud should be fast and trouble free. 

However, there can occasionally be a glitch in that connectivity path that results in network latency, which impacts call quality. Based on our troubleshooting experience, we have discovered that the majority of those glitches are located on the customer’s LAN. The glitch could be caused by an overloaded workstation running with the minimum system requirements for Genesys Cloud or it could be the result of an improperly configured firewall.

To help you diagnose those glitches on your LAN, you can use the Genesys Cloud Network Readiness Assessment. You can get this tool by opening a support case. For more information, see My Support Portal.

In this article, you’ll find detailed instructions on how to run and interpret the results provided by the Genesys Cloud Network Readiness Assessment tool.

If you have questions, see the Genesys Cloud Network Readiness Assessment FAQ.

What is the Genesys Cloud Network Readiness Assessment?

The first thing that you must understand about the Genesys Cloud Network Readiness Assessment is that it is designed to provide a moment in time snapshot of your LAN. As such, we recommend that you run it multiple times and on multiple systems in order to gain an accurate assessment of your LAN’s performance.

The results generated by the Genesys Cloud Network Readiness Assessment can vary significantly based upon when you run the tool and the network load at that time. If there are large variances in your network’s load, then you should run it when you believe that your network is busiest to ensure that the results indicate what you would consider acceptable performance for your planned load.

With that in mind, the Genesys Cloud Network Readiness Assessment looks at the network performance (bandwidth, jitter, latency) as well as the connectivity (firewall settings) and help you to understand potential issues.

Run the tool

We recommend that you run the Genesys Cloud Network Readiness Assessment on various computers on your network and various times throughout a normal work day. 

Run the Genesys Cloud Network Readiness Assessment

  1. Click the link in the email that you receive from Genesys.
  2. If prompted, download and run the BCS client.
    • NOTE: The BCS client is a client side application that enables accurate VoIP, SIP, Route testing from within a browser.
  3. Select the correct AWS region.
  4. Enter your organization name.
  5. Click Start the Test. (As the test runs, you’ll see a progress animation.)
  6. When the test is complete, you can look over the results using the information in the Understanding the results section below as a guide.
  7. To save the results to a file, click Download Results.
  8. The results file will appear as a .TXT file in your browser’s status bar. For more information, see the Compiling the Results section below.

Understanding the results

When you run the Genesys Cloud Network Readiness Assessment, you’ll see the results displayed in two columns titled VOIP and Firewall. 

VOIP

The VOIP column on the left side displays the results of your overall network performance. Proper network performance is critical for voice calls, internal video calls, co-browsing, etc. 

NOTE: To be able to understand the VOIP metric descriptions, you need to have a basic understanding of what a network packet is. When data is sent over a network, it is divided up into multiple small units called packets. Along with the data, each packet contains control information that essentially identifies the data. More specifically, control information provides the source and destination network addresses, sequencing details, and error detection. The source and destination network addresses are self-explanatory. The sequencing details are instructions on how the packets should be reassembled and the error detection identifies corruption in the packets. There are many other very technical pieces that make up a packet’s control information, but as far as the Genesys Cloud Network Assessment goes, these are the three main pieces of information that you need to understand.

Measurement Expectation Description

Up/Down Jitter

The up and down jitter metric should be less than 30ms.

If you see jitter metrics that are consistently higher than 30ms, then you need to take a closer look at the amount and type of traffic on your network.

Jitter is a variation between the time when packets are sent and when they are received. When sending, packets are evenly spaced and flow in a continuous stream. Due to network traffic, the packets can become unevenly spaced and the flow can be inconsistent. The receiving end compensates for this by buffering the packets and then passing them on in an evenly spaced continuous stream.

Up/Down Packet Loss

The up and down packet loss metric should be less than 1%. When packets fail to reach the destination due to heavy network traffic or total corruption, the network must resend the data. This impacts overall network performance
Packet Discards The packet discards metric should be less than 5%. When the jitter buffer exceeds is limits, the buffer discards any additional packets.
Packet Order The packet order metric should be 98+%. When packets travel over a network, they may take different routes and therefore arrive in a different order than they were sent. This can be compensated by jitter buffers as long as the packets arrive quickly enough to be re-sequenced and do not have to be discarded.
Round Trip Average Time The round trip average time metric should be below 150ms. The round trip average time measures the latency between the selected Genesys Cloud AWS region and your location. 

Up/Downstream MOS Score

The MOS score metric should be 3.6 or higher.
The MOS scores provide a range between poor and excellent voice quality. The MOS score is based on all the network performance measurements and will  incrementally decrease as the other other measurements deviate from the recommended values. 


Firewall

The Firewall column on the right provides a simple Pass/Fail test on your firewall. All of the ports listed in this column must be open on your firewall in order for Genesys Cloud and your network to communicate properly.

All ports, with the exception of Port 53 and Port 19302, should be marked with a green check and be identified as passed.

NOTE

  • Port 53 is used by DNS and is usually flagged with a red x and identified as failed. This is common and nothing to worry about.
  • Port 19302 is used by STUN and is optional and may be flagged with a red x and identified as failed. If you are not using STUN, then this is nothing to worry about.

If any of the ports, other than 53 or 19302, are flagged with a red x and identified as failed, you will need to open those ports on your firewall. For more information, see:

Compiling the results

After you run the Genesys Cloud Network Readiness Assessment and download the results, you’ll want to add the results in an Excel spreadsheet You’ll want to do so for each computer on which you run the tool. (If there are multiple issues, having all the data in a spreadsheet will help Genesys Cloud Customer Care more efficiently troubleshoot the problem.) You can download an Excel spreadsheet template here

NOTE: The spreadsheet template contains sample entries so you can see how to compile your data.

  1. When assessment results appear in your browser’s status bar, open the .TXT file.
  2. Press CTRL-A to select all the results data in the file.
  3. Press CTRL-C to copy the data to the clipboard.
  4. Access the Excel spreadsheet template.
  5. Press CTRL-V to paste the results data in the spreadsheet. 
    • TIP: To make collecting the data from the Genesys Cloud Network Readiness Assessment as easy as possible, consider using a USB flash drive. 
    1. On the drive, save a link to the Genesys Cloud Network Readiness Assessment and save the Excel spreadsheet template.
    2. When you get the assessment results, save the .TXT file with a unique name on the drive
    3. Add the results data to the spreadsheet. 
    4. This way, when you finish you will have everything in one place.

Prerequisites: See Roles and permissions for pairing organizations and Roles and permissions for authorized users and groups.

If another organization wants to pair with you, you receive an email that contains a generic pairing link. For example: https://apps.mypurecloud.com/directory/#/admin/people-permissions/auth-orgs/pair/9d0230d0-6b16-4f15-bfbb-aa5085ee1450

NOTE:A pairing link expires after seven days.

  1. Click the link and read the message. 
    • WARNING: Do not approve a pairing request unless you know the sender.
    • NOTE:When granting system access to another user or group (“permitted user”), be aware that you are responsible for how the permitted user uses your system. Genesys is not responsible for any misuse of data, change to configuration, etc.
  2. To accept the request, click Yes, I authorize access.
  3. Select the appropriate role for the user or group.
    • NOTE: All members in the group receive the role and the associated permissions.

NOTE

  • The roles you assign here determine how the user or group can work in your organization. 
  • Assign only the roles that you are comfortable providing to the other organization. In the typical customer-to-partner scenario, it is common for the customer to assign the Master Admin role or the Admin role to their partner’s users or groups. Other roles may be necessary when working with Customer Care.

The following outlines the best practice guidelines for Activating an Org as a Partner on behalf of your customer.

Once your Genesys Cloud order gets booked, we strongly recommend activating the org as soon as possible to begin your configuration and start your build.

Additional resources:

WARNING

Before activating a new org, manually log out of all other Genesys Cloud orgs. To log out, when inside the app or using a browser. access user settings from your profile header in the sidebar, then click Logout.

1. Create a new Cloud account

  1. From your Activate your Genesys Cloud email, click Activate.
    • NOTE: If you have not received your Activation Email, contact your Channel Rep or call Sales at 888-GENESYS (888-436-3797) for assistance. If you encounter other activation issues, send an to email onboarding@genesys.com.com with the Organization ID information and screenshots of the error or issue.
  2. Select your AWS Region via the dropdown.
  3. Click Sign Up.
  4. On the Create your Genesys Cloud Account screen, enter the desired Company Name of your customer.
    • NOTE:: The Company Name will become the org shortname. This unique identifier is used to specify the org when logging in. It can not be changed once set. From the Company Name field, the shortname is created as follows:
      • All letters are lowercase
      • Spaces and special characters are removed, except for dashes
      • If the shortname already exists, a number is added at the end.
  5. Input your name, work email address, and password as the first user account in the org.
  6. Click Next.
  7. From here, you’ll have the option to invite others into the org by inputting their first name, last name, and work email address.
    • NOTE: This can also be done later while inside the org.
  8. Click Activate Now.

2. Login with your new Cloud account

  1. When you arrive at the Login screen, select the correct AWS Region.
  2. Click More Login Options.
  3. Enter your org shortname.
    • NOTE: The Company Name will become the org shortname. This unique identifier is used to specify the org when logging in. It can not be changed once set. From the Company Name field, the shortname is created as follows:
      • All letters are lowercase
      • Spaces and special characters are removed, except for dashes
      • If the shortname already exists, a number is added at the end
  4. Click Next.
  5. Enter your credentials.
  6. Click Login.
  7. Once logged in, click Continue.
  8. You will receive an email titled Thank you for activating your Genesys Cloud features.
  9. You will also receive an email titled Welcome to Genesys Cloud which will include links for:
    • Logging in
    • Downloading apps
    • A link for inviting others into the new org

When Product Support receives a RAM alarm from the customer's Workbench instance, the following process is actioned:

  1. The respective alarm (the supported subset of Genesys Engage alarms ingested by Workbench) is routed to Product Support and a Support Case is opened by a Genesys Product Support Analyst.
  2. The customer provided Group Email will receive an email from Product Support informing you that an alarm Support Case has been opened.
  3. The Product Support Case will follow standard service level targets based on your Genesys Care contract.
  4. Only the Designated Contact can view, manage and close the support case via My Support; however, all members on the group email can provide case updates via email.
  5. An Alarm notification is sent to you via the Genesys Care Mobile App, if notifications are enabled.

NOTE: When granting system access to another user or group (“permitted user”), be aware that you are responsible for how the permitted user uses your system. Genesys is not responsible for any misuse of data, change to configuration, etc.

An administrator from the Genesys Cloud organization in which the authorized users and groups work must assign the appropriate permissions to them. For example, in a customer-to-partner scenario, a customer must assign the appropriate permissions to the users and groups from the partner. Roles are predefined sets of permissions that streamline the process of assigning permissions.

Access control for authorized users and groups

Be aware of access control when you allow authorized groups or users the access to work in another organization. Genesys Cloud automatically grants authorized groups or users access to all divisions assigned to the roles that the member receives by pairing with the organization. 

Permissions for authorized users and groups

This table lists all the permissions that are available for authorized users and groups. You can assign any permission to any user or groups.

This permission Allows these actions
Authorization > Orgtrustee > Add Create a trust relationship and send the pairing request
Authorization > Orgtrustee > Delete Delete authorized users
Authorization > Orgtrustee > View  View authorized users
Authorization > Orgtrustee > Edit Enable and disable authorized organizations, and add and remove authorized users in an authorized organization
Authorization > Orgtrusteeuser > All Permissions View, edit, and delete new authorized users
Authorization > Orgtrustor > View View information about an authorized organization
Authorization > Role > View

View Genesys Cloud roles

Note: To grant roles to authorized users, you must have this permission.

Minimum permissions

All external authorized users and groups require the following permissions.

This permission Allows these actions
Authorization > Orgtrustor > View View information about an authorized organization
Authorization > Orgtrusteeuser > View View authorized users

Trusted External User role

An administrator must assign the Trusted External User role or the minimum permissions to all authorized external users and groups who work in the organization.

NOTE:The Trusted External User role is available only for Genesys Cloud organizations created on or after May 17, 2017. If your organization was created before May 17, 2017, create a custom role that has the minimum permissions necessary for authorized users. For more information, see Example of a custom role (Trusted External User).

Master Admin role

In the typical customer-to-partner scenario, it is common for customers to assign the Master Admin role to the authorized users from their partner. The default Master Admin role has all the permissions that are necessary for a user or group to administer your organization. When you seek assistance, Customer Care may require other permissions and roles.

NOTE: The permissions that a role contains are what enables a user to perform an action. Because you can modify existing roles, it is important to be sure that a role has the permission(s) required to perform a specified action.

If you do not want to assign the Master Admin role to an authorized user or group from another organization, create custom roles that contain only the permissions you want to assign. 

Example of a custom role (Authorized User Admin)

Here is an example of a custom role that provides the minimum permissions that are necessary for an authorized user or group.

  1. Add a custom role called Authorized User Admin.
  2. Assign the following rights to the Authorized User Admin role.
This permission Allows these actions
Authorization > Orgtrustee > Add Create trust relationship and send the pairing request
Authorization > Orgtrustee > Delete Delete authorized users
Authorization > Orgtrustee > View View authorized users
Authorization > Orgtrustee > Edit Enable and disable authorized organizations, add, and remove authorized users in an authorized organization.
Authorization > Orgtrusteeuser > All Permissions View, edit, and delete new authorized users
Authorization > Orgtrustor > View View information about an authorized organization
Authorization > Role > View View Genesys Cloud roles

NOTE: A user who grants roles to authorized users needs this permission.

Example of a custom role (Trusted External User)

Here is an example of a custom role that provides the minimum permissions that are necessary for an authorized user or group. 

  1. Add a custom role called Trusted External User.
  2. Assign the following rights to the Trusted External User role.
This permission Allows these actions
Authorization > Orgtrustor > View View information about an authorized organization
Authorization > Orgtrusteeuser > View View authorized users

Minimum permissions for partners

If you are a partner and you want to work with your clients, you must have the following permissions:

View your clients

To view your clients, you must have a role with these permissions:

  • affiliateOrganization > clients > View
  • externalOrganization > externalContacts > View
  • authorization > orgTrustee > View

Pair with your clients

To pair with your clients, you must have a role with these permissions:

  • Authorization > Orgtrustee > Add
  • AffiliateOrganization > Clients > Pair
  • AffiliateOrganization > Clients > View
  • ExternalOrganization > Externalcontacts > View

Prerequisites: See Roles and permissions for pairing organizations and Roles and permissions for authorized users and groups.

After you approve a pairing request, you must authorize users and groups to work in your organization. To authorize users and groups, assign them the roles their work requires.

NOTE:When granting system access to another user or group (“permitted user”), be aware that you are responsible for how the permitted user uses your system. Genesys is not responsible for any misuse of data, change to configuration, etc.

When an administrator sends you a pairing link, the administrator can request authorization for multiple users and groups. Later, the administrator can request authorization for other users and groups as well. The maximum number of users that can access another organization is 25.

  1. Click Admin.
  2. Under People and Permissions, click Authorized Organizations.
  3. Click Access To My Organization
  4. Click the name of the paired organization.
  5. Click the user’s or group’s name.
  6. Under Roles, search for and select the roles for the user or group.

NOTE

  • The default Master Admin role has all the permissions that are necessary for a user or group to administer your organization. When you seek assistance, Customer Care may require other permissions and roles.
  • The permissions that a role contains are what enables a user to perform an action. Because you can modify existing roles, it is important to be sure that a role has the permission(s) required to perform a specified action.
  • Until an administrator assigns one or more roles to a user or group, the user or group cannot work in the organization.
  • When an administrator selects a role for a user or group, that user or group receives access immediately.

Auth Orgs is Care's implementation of a Genesys Cloud feature called Authorized Organizations. ​

Care combines the Authorized Organizations feature with OneLogin and Genesys Cloud Orgs in each AWS region to create the Auth Orgs system. Through this system Care can perform tasks inside a customer's org in a way that the customer controls, using the same roles used to manage their internal users. With authorized organizations, you can establish a secure relationship with another Genesys Cloud organization. This relationship allows permitted users and groups from one organization to log in to another organization.

Manage the pairing between two Genesys Cloud organizations

Learn how two organizations become paired. Create and send a pairing ID to an organization you want to pair with. If you receive a pairing request, understand what it means to accept it. Remove access or delete a pairing if necessary.

Manage authorized users and groups

Allow users and groups from another Genesys Cloud organization to work in your organization and track their activity.

See your relationships 

See which organizations you can work in, and see who can work in your organization. 

Support Users and Cloned Users

Once pairing is completed, Care will access a customer’s Org in one of two ways:

  • Via a Support Org User​
  • Via a Cloned User​

Access granted to these users is controlled by the role(s) the customer assigns to the pairing link. ​Actions taken by Care using either a Support Org User or Cloned User are audited as the first & last name of the engineer taking the action.​ Support Org Users are for tasks such as checking configurations, running reports, or reviewing specific interactions.​ Cloned Users are for agent tasks such as placing/receiving calls or ACD interactions or using Genesys Cloud chat features. 

To establish a pairing between two organizations, you must have specific permissions in your home organization. 

NOTE: When granting system access to another user or group (“permitted user”), be aware that you are responsible for how the permitted user uses your system. Genesys is not responsible for any misuse of data, change to configuration, etc.

Initiate a pairing request

To initiate the pairing request, you need one of these permissions:

  • Authorization > Org Trustee > All
  • Authorization > Org Trustee > Add

Authorize the pairing request

To authorize the pairing request, you need these permissions:

  • Authorization > Org Trustor > All 
  • Authorization > Org Trustor > View

Authorize users and groups

To authorize users and groups from another organization to work in your organization, you need these permissions:

  • Authorization > Org Trustee User > Add
  • Authorization > Org Trustee User > View
  • Authorization > Org Trustee Group > Add
  • Authorization > Org Trustee Group > View
  • Authorization > Role > View

An authorized user is a user who has permission to work in an organization other than the user’s home organization. By managing authorized users and groups, you can allow users and groups from another Genesys Cloud organization to work in your organization and track their activity.

For example, if you are in a trusted relationship with a partner, you can allow the partner’s users to help you configure your Genesys Cloud organization. The partner’s team of support personnel are authorized users for a customer’s organization.

You can assign roles and permissions to ensure that each user or group has the appropriate level of access. You can also remove access if necessary. Use groups to streamline the management of which users have access to your organization.

To streamline the management of authorized users, use groups. Create groups in your home organization. Then request permission for them to work in another organization. All members in the group receive the same roles and permissions. If you change the membership of the group by adding or removing a user, you do not affect the other members of the group.

NOTE

  • An organization can have a maximum 25 authorized users.
  • Genesys Cloud tracks authorized users separately from regular Genesys Cloud users. Authorized users do not affect user counts for the purposes of licensing and billing.

Authorized users assist only with administrative tasks. The following functionality is unavailable to an authorized user in another organization.

Feature Details
Alerting This feature is not available
Chat
  • Authorized users cannot chat with other users
  • Authorized users cannot search chats in public groups
Interactions
  • The authorized user cannot receive interactions
  • The agent dashboard does not load because the authorized user has no interaction statistics
  • The active interactions panel does not load because the authorized user has no interactions
Phone calls This feature is not available
Video conferences This feature is not available

Auth Orgs customers can control​:

  • When Care can access their Org​
  • The permissions Care has when accessing their Org

Disable access entirely

  1. Go to Admin > Authorized Organizations > Access To My Organization.
  2. Toggle Access to Off.

Limit access

  1. Go to Admin > Authorized Organizations > Access to My Organization > [Support Org Name].
  2. In the Groups tab, add or remove roles in the Role(s) section as desired.

The pairing process authorizes users and groups from one Genesys Cloud organization to work in another Genesys Cloud organization.

Examples

  • A Genesys partner can assist a client in configuring, managing, or troubleshooting Genesys Cloud.
  • A manager from a parent company can log in to a subsidiary organization to view usage reports.
  • An application developer or an independent consultant can log in to a client organization to assist with customizations.

Notes

  • Any organization can generate or receive pairing requests.
  • You can pair with any other organization in your region.
  • An organization can have multiple paired relationships, although each pairing can involve only two organizations. For example, a partner can have a separate paired relationship with each of its client organizations.

Process

  1. Your organization generates a pairing request and sends it to the other organization
  2. The other organization approves the pairing request and grants the appropriate permissions to users from your organization
  3. Your organization, if necessary, promotes additional users to work in your organization
  4. The other organization, as appropriate, approves the additional users from your organization to work in the other organization
  5. Users from your organization log in to the other organization and perform requested work

Prerequisites: See Roles and permissions for pairing organizations and Roles and permissions for authorized users and groups.

  1. Click Admin.
  2. Under People and Permissions, click Authorized Organizations.
  3. Click Create Pair. In the Add new person or group box, begin typing the name of the Genesys Cloud user or group in your organization who needs access to the other organization. Then select the user or group from the list. Tip: To see the users who already have access, click the Users tab. To see the groups who already have access, click the Groups tab.
  4. In the Add new person box, begin typing the name of the Genesys Cloud user in your organization who needs access to the other organization. Select the user from the list.
  5. Repeat step 4 to select more people. 
  6. Click Click to Copy. The pairing link is now in your clipboard.
  7. Paste the pairing link into an email or chat message and send it to the person at the other organization you want to pair with.

Prerequisites: See Roles and permissions for pairing organizations and Roles and permissions for authorized users and groups.

When two organizations are in a paired relationship, either side can remove access at any time.

NOTE: If you remove access from another organization, but the pairing with that organization remains, then you can reenable access to that organization at any time. All authorized users keep their roles.

  1. Click Admin.
  2. Under People and Permissions, click Authorized Organizations.
  3. Click Access To My Organization or Access to Other Organizations, depending on how the pairing was established.
  4. Do one of the following:
  5. To remove the pairing with another organization, next to the organization’s name, click the X.
  6. To disable temporarily the trust relationship, under Access, slide the toggle to Off.

Prerequisites: See Roles and permissions for pairing organizations and Roles and permissions for authorized users and groups.
  1. Click Admin.
  2. Under People and Permissions, click Authorized Organizations.
  3. Click Access To My Organization

Prerequisites: See Roles and permissions for pairing organizations and Roles and permissions for authorized users and groups.

When you are part of a trust relationship with another organization, either party can remove access from any user or group in that relationship.

NOTE

  • If your organization has users and groups from another organization working in it, then you can remove either specific roles from those users or groups, or you can remove those users or groups completely.
  • If your organization’s users or groups work in another organization, then you can remove those users or groups. 
  • If you remove access from a user or group while the user or group member is logged in to your organization, the user or group member is immediately logged out.
  1. Click Admin.
  2. Under People and Permissions click Authorized Organizations.
  3. Click Access To My Organization or Access to Another Organization.
  4. Click the organization name. The list of users appears.
  5. To remove access from a user, click the Users tab.
    • To completely remove access for a user, click the x next to the user’s name.
    • To remove a role from a user, next to the user’s name, click the x for the role you want to remove.
  6. To remove access from a group, click the Groups tab.
    • To completely remove access for a group, click the x next to the group’s name.
    • To remove a role from a group, next to the group’s name, click the x for the role you want to remove.
  7. To remove access from a user, next to the user’s name, click the x.
  8. To remove a role from a user, click Access to Another Organization. Next to the user’s name, click the x for the role you want to remove.  

Prerequisites: See Roles and permissions for pairing organizations and Roles and permissions for authorized users and groups.

When two organizations pair, the administrator of the organization providing the users or groups to complete the work requests authorization for them. The administrator of the organization in which the work will be performed assigns the roles for those users or groups.

Later, the same process of requesting and authorizing users and groups can occur if additional authorized users are needed. The maximum number of authorized users and groups that can access another organization is 25.

Note: When granting system access to another user or group (“permitted user”), be aware that you are responsible for how the permitted user uses your system. Genesys is not responsible for any misuse of data, change to configuration, etc.

  1. Click Admin.
  2. Under People and Permissions, click Authorized Organizations.
  3. Click Access To Other Organizations.
  4. Click the organization name. 
  5. In the Add New Person or group box, begin typing the name of the person or group who needs access.
  6. Click the user or group in the list. 
    • NOTE:The user or group does not yet have any roles in the organization, and therefore cannot perform work in it. An administrator in the other organization must authorize the user or group first.
  7. The administrator in the other organization grants access and assign the roles to the user or group.

Prerequisites: See Roles and permissions for pairing organizations and Roles and permissions for authorized users and groups.

You can see the users and groups from another organization who work in your organization.

  1. Click Admin.
  2. Under People and Permissions, click Authorized Organizations.
  3. Click Access To My Organization.
  4. Click the organization name. To see the list of authorized users, click the Users tab. To see the list of authorized groups, click the Groups tab. The list of users from the organization with roles in your organization appears.

To see who is in a trust, you must be a member of its trusted group

Genesys Cloud’s Authenticated Organizations feature establishes a circle of trust between organizations. This circle of trust permits a user who authenticated with their home organization to access an external organization for which they do not have a user account. To view the names of other users in the trust, or the names of groups authorized by the trust, a user must be a member of the trusted group.

Notes:

  • A user must be a member of the trusted group to do the following:
    • View details about the trust and its members.
    • Access the external organization.
  • An untrusted user sees an empty list of users and groups in the trust along with a message about missing permissions.
  • If you are not a member of the trusted group, Genesys Cloud does not reveal its name to you.
  • To have yourself added to the group authorizing the trust, contact your Genesys Cloud administrator.

Prerequisites: See Roles and permissions for pairing organizations and Roles and permissions for authorized users and groups.

To assist another organization with testing or troubleshooting, you can clone a user within trust. The cloned user inherits all permissions granted from the trusting organization. You can have up to five cloned users in an organization. 

Once cloned, the trusting organization is able to manage the user like any other user within the organization. 

Note: When granting system access to another user or group (“permitted user”), be aware that you are responsible for how the permitted user uses your system. Genesys is not responsible for any misuse of data, change to configuration, etc.

To be cloned, a user must be trusted as a named user or part of a trusted group through a pairing request. For more information, see Create and send a pairing request to an authorized organization.

  1. Click Admin.
  2. Under People and Permissions, click Authorized Organizations.
  3. Click the Access To Other Organizations tab.
  4. Click the name of the paired organization.
  5. Select a trusted user or a user from a trusted group. 
  6. Under Cloned Users, select a user or user from a trusted group.
  7. Log out of Genesys Cloud.
  8. Log back into Genesys Cloud and select the targeted organization.

Note: Cloned users are non-billable and are limited to 5 at any given time within a trust.

Prerequisites: See Roles and permissions for pairing organizations and Roles and permissions for authorized users and groups.
  1. Click Admin.
  2. Under People and Permissions, click Authorized Organizations.
  3. Click Access To Other Organizations.

FedRamp cases are excluded from the mobile app. 

Support contacts are unable to use the mobile app for FedRamp cases, FedRamp orgs, or access the FedRamp My Support Portal.

Genesys Care delivers tools that assist our customers with troubleshooting and diagnosing application problems. The Log File Management Tool (LFMT) provides a central repository for the storage of application log files, and an interface for retrieving a set of specified log files. The LFMT has two components, the LFMT Server and the LFMT Client.

LFMT Collector performs the following functions:

  • Deploys on the LFMT Server Host(s).
  • Initiates scheduled and real-time collection requests by the LFMT Client
  • Application hosts are queried for new or modified log files only.
  • Log files are copied from application servers to the LFMT Server Host(s).
  • Log files are compressed for transfer (~10:1).
  • Log files are encrypted for transfer (default is AES128-cbc).
  • Creates log file packages resulting from user queries in the LFMT Client.
  • Masks sensitive data in log file packages created by a user in the LFMT Client.

LFMT Indexer performs the following functions:

  • Deploys on the LFMT Server Host(s).
  • Indexes log files collected by LFMT Collector.
  • Compresses log files for reduced storage.
  • Purges log files based on a user specified retention period.

The LFMT Client allows you to:

  • Configure the index settings for log snapshots stored on the Log Server.
  • Specify the right log snapshots to collect and package for transfer to Product Support when a problem occurs.
  • Upload the packaged log files directly to the FTP folder associated with your open problem ticket, using secure FTP protocols.

Check the System Requirements. Prior to installing LFMT, you will want to review the Pre-Installation Considerations in the Deployment and User Guide.

The Genesys Care Log File Masking Utility is a standalone version of the data scrubbing function in the Log File Management Tool. This utility is meant for users who have not had the benefit of downloading and installing our Log File Management Tool (LFMT). It serves the important need of sanitizing sensitive information from log files before they are sent to Product Support for support case investigation.

In addition, the Log File Masking Utility provides:

  • Robust scrubbing when multiple regular expressions are defined
  • The ability to scrub multiple entries from a single line in a log file with one regular expression

Please read the Data Safeguarding Suggestions for On-Premises Software for additional information on protecting sensitive company data. Product Support also encourages the download and installation of the Log File Management Tool for greater benefits with log file management and data correlations with Workbench.

Download

  1. Login to My Support.
  2. Click Continue to your Dashboard button.
  3. On the Dashboard screen, select the Apps and Tools tile.
  4. On the Apps and Tools screen, select the Workbench tile.
  5. On the Genesys Care Workbench screen, click Download Workbench link.
  6. On the Terms and Conditions screen, click the checkbox to accept the Terms and Conditions, and click Download.
  7. On the zip screen, click Download again.
  8. The result of the above is, depending on the target Workbench host(s) Operating System, a locally downloaded:
    • Workbench_9.x.xxx.xx_WINDOWS.zip file
    • Workbench_9.x.xxx.xx_LINUX.tar.gz file

Configuration

The WB Configuration Console allows the user to manage, configure and view the state/status of the WB components.

WARNING: Use the Delete option with extreme caution; please read and understand these instructions before proceeding:

  • This will permanently delete the WB Host Object from the WB UI and also backend configuration
  • The WB Delete action will NOT delete the respective binaries from the host; that will be a manual task via the respective host post deleting in the WB UI
  • WB Primary Host deletion is NOT supported - only WB Additional Hosts/Nodes can be deleted
  • Pre-Cluster formation
    • Delete WB Secondary WB Host object from configuration page under Host section
      • ALL associated WB component config data will be permanently removed
      • Now and only when the WB Host is deleted, delete the associated Hosts WB Application component config objects one-by-one under Applications section
  • Post-Cluster formation WB Host deletion is NOT recommended

Sub menus

Overview

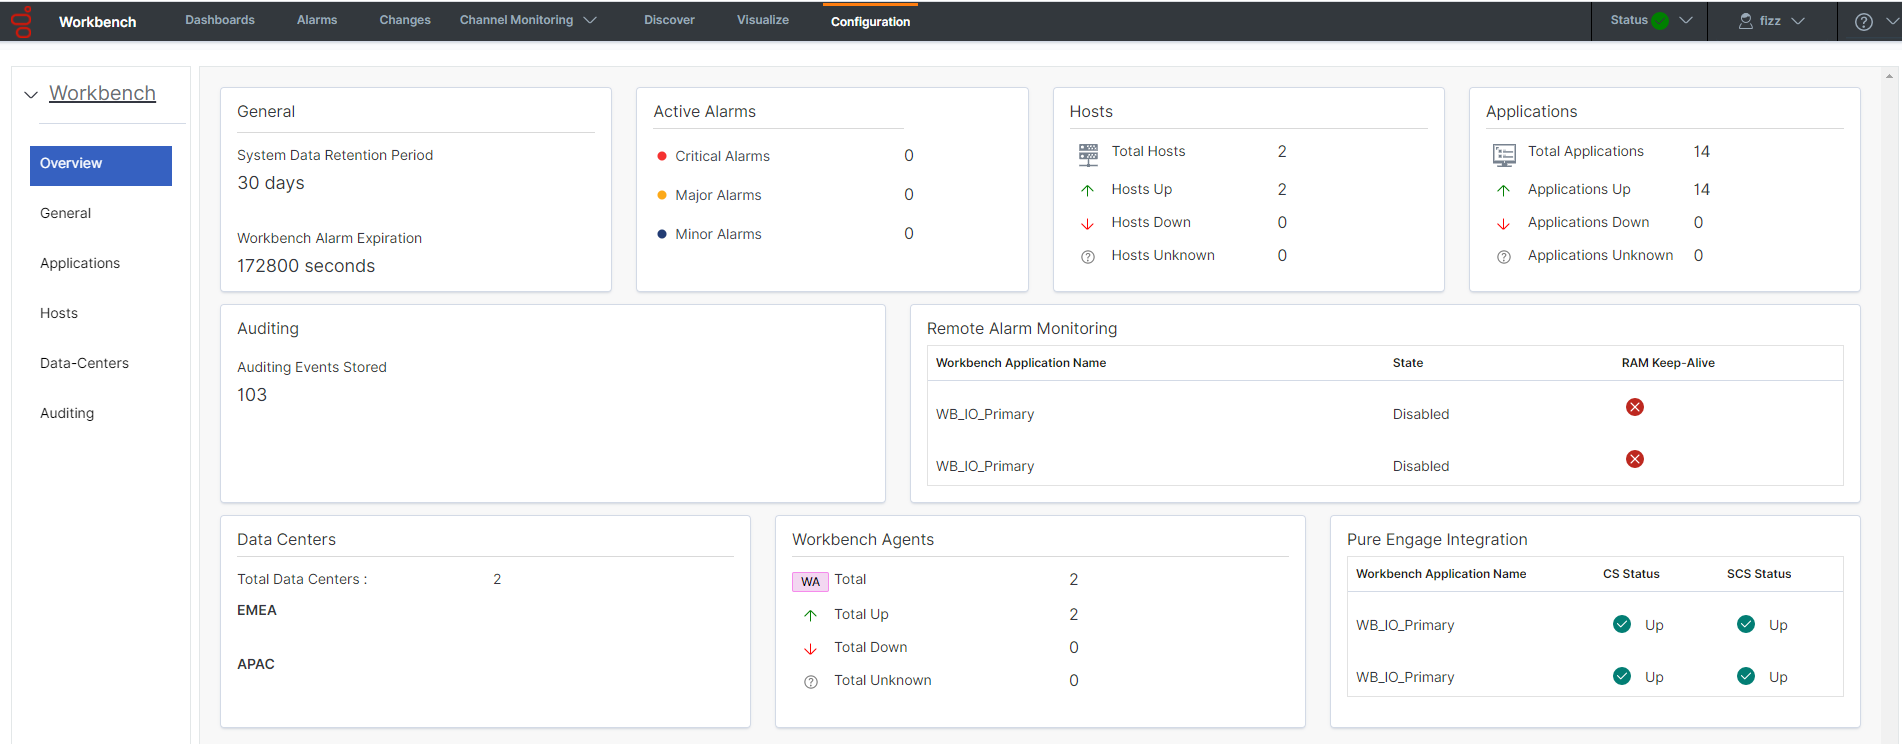
Gain an at-a-glance overview of the state, status and content of the WB components and features

General

System Data Retention Period - this applies to the data stored within WB and the duration for which its stored; if this setting is enabled, data will be permanently deleted post this value; the default is Enabled and 30 days

NOTE: Data Retention values not updated in real-time when viewing this page

Alarm Expiration - this applies to the WB Active Alarms duration, if not resolved, if this setting is enabled, WB alarms (not Genesys Engage) will be automatically closed post this value - i.e. to avoid manually clearing 100 Channel Monitoring active alarms, they would be automatically cleared post this value; the default is Enabled an 172800 seconds (2 days)

NOTE: Alarm Expiration values not updated in real-time when viewing this page

Session Expiration - this applies to the timeout of sessions; Users will be auto logged out of WB if/when a new request is greater than the Session Expiration; if/when the Session Expiration setting is unchecked/disabled, Users will never be auto logged out

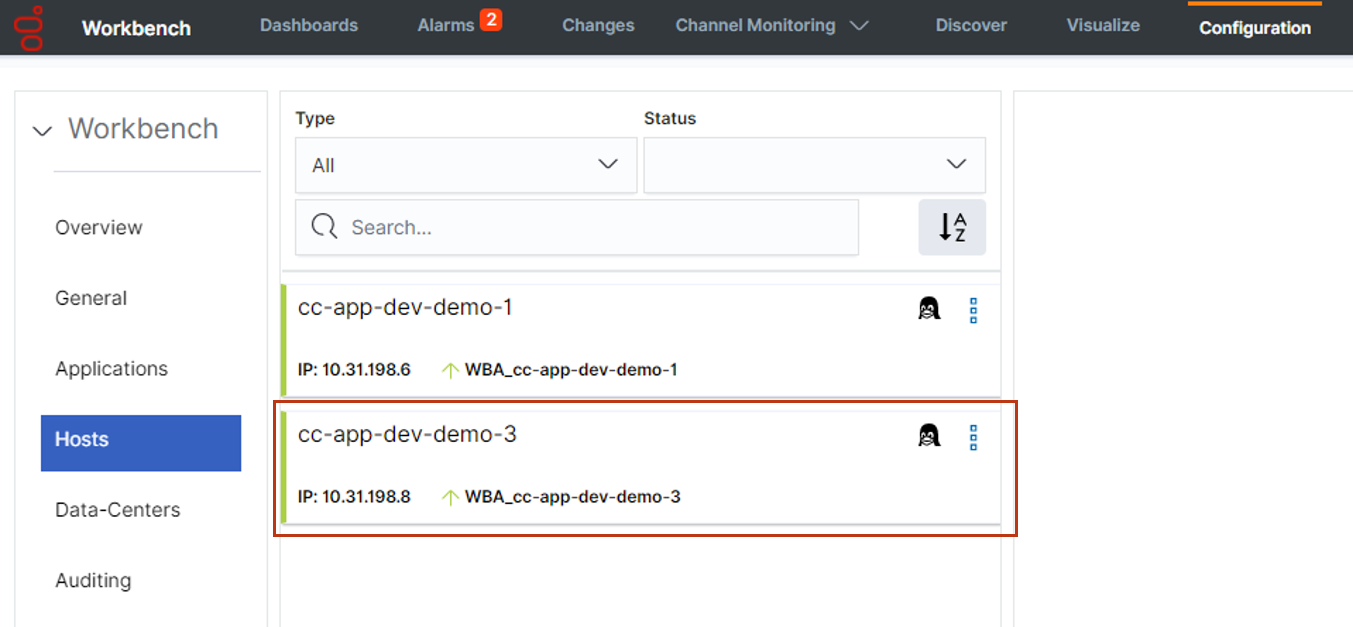
Hosts

  • These are either WB hosts or Engage hosts
  • Engage hosts will only be present if the WB Agent is installed on the respective Engage host (i.e. SIP Server host)
  • Only deploy the WB Agent on Engage hosts that you wish to ingest metric data (CPU/RAM/DISK/NETWORK) from
  • This Configuration section allows read-only visibility of WB Host Objects
    • The WB Host objects can be:
    • Deleted (i.e. should there be a need to move/re-install WB Additional components to a new Host/Server)

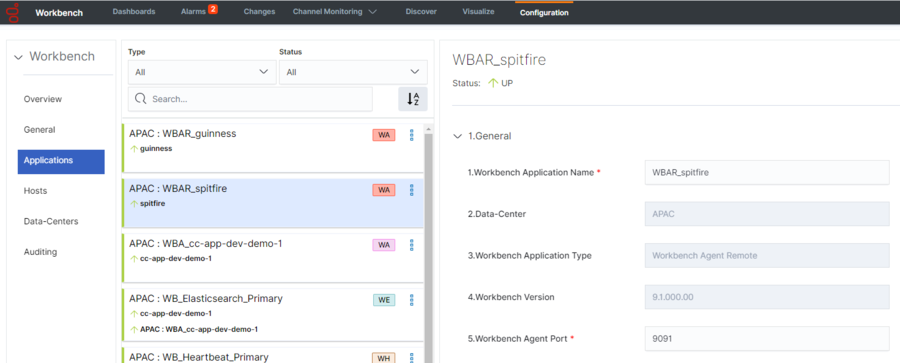
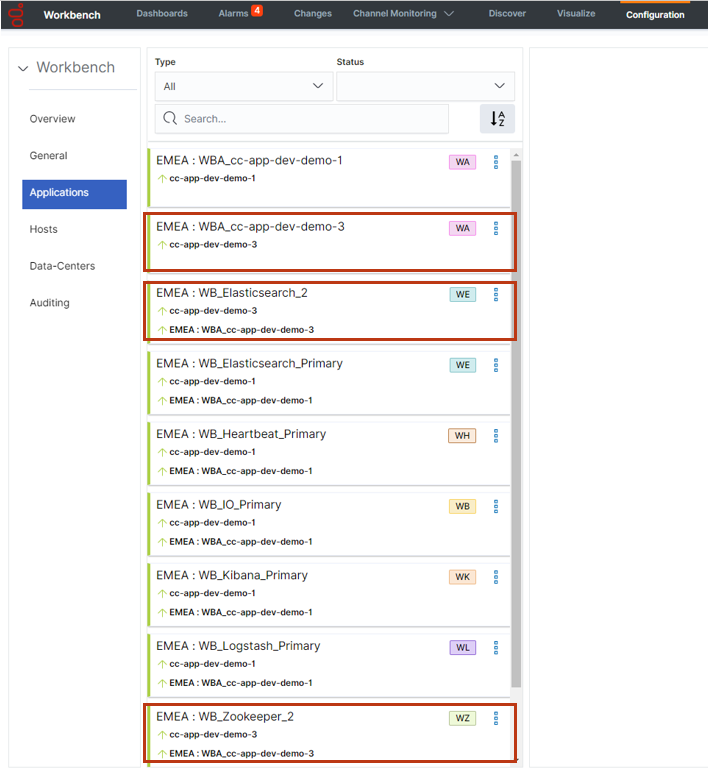
Applications

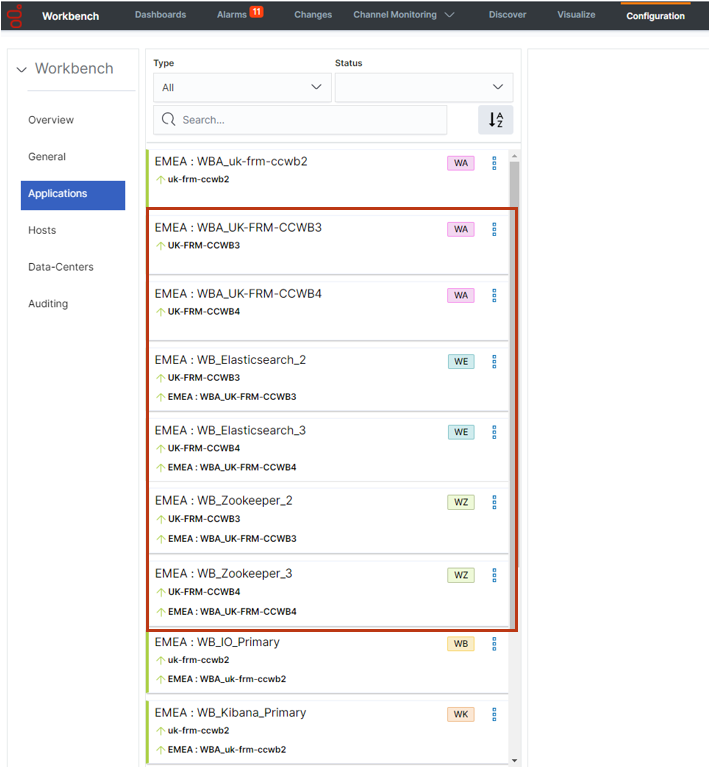
  • In WB 9.1 there are 8 x WB Application Objects:
    • WB IO (for WB UI and integration to Genesys Engage including the Channel Monitoring feature)
    • WB Agent (for WB status, control and configuration - in WB 9.0 WB Agents are ONLY installed on WB hosts, not Genesys Engage hosts)
    • WB Elasticsearch (for WB storage)
    • WB Kibana (for WB UI)
    • WB Logstash (an ETL pipeline primarily relating to WB Agent Metric data ingestion)
    • WB Heartbeat (for WB component health monitoring)
    • WB Metricbeat (for Host/Process Metric data ingestion in conjunction with the WB Agent component)
    • WB ZooKeeper (for WB configuration)
  • This Configuration section allows visibility and management of the Application Objects above
    • The Application Objects can be:
      • Renamed (i.e. WB_IO_Primary to APAC_WB_IO_P)
      • Edited (i.e. change the [WB_Kibana_Primary\HTTP Port] setting from the default 8181 to 9191)
      • Deleted (not the WB Primary host Applications)

Data-Centers

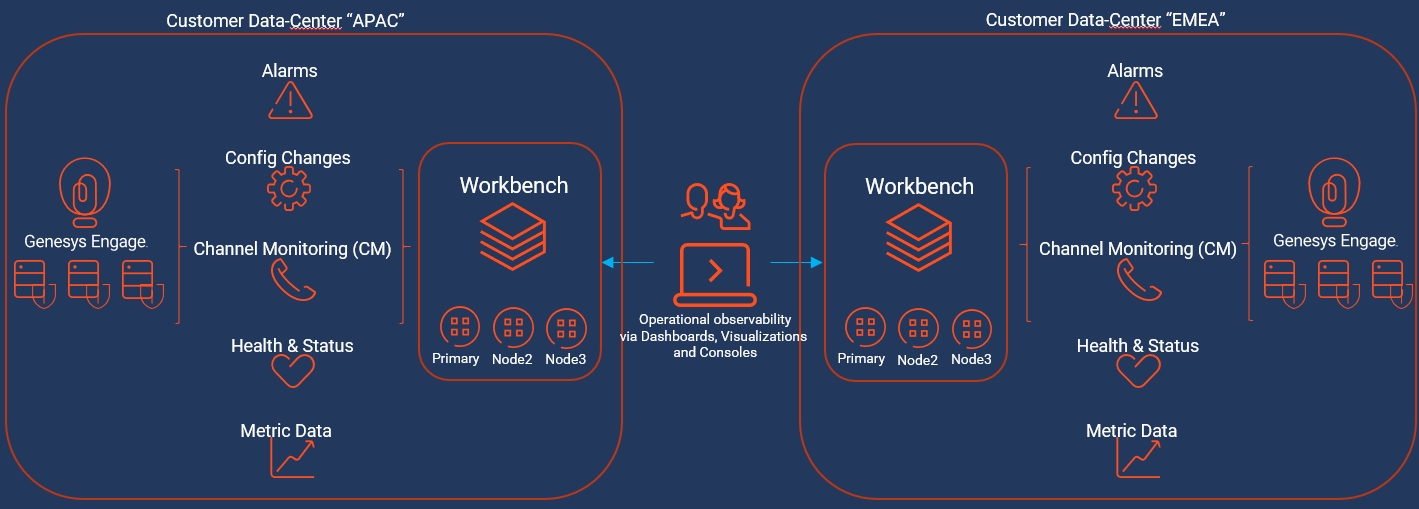
  • The Data-Center(s) name(s) are provided during WB installation and will be displayed according to the value(s) entered

Auditing

  • The WB Audit Console is similar to the Changes Console but also provide visibility of WB User Logins/Logouts; the Audit events will also evolve overtime
    • NOTE: Audit events are not updated in real-time when viewing this page

Before you install

Activation

Once you receive your WB RAM license key from Product Support, activate your subscription.

WARNING: Only 1 x WB IO application in a multi node WB Cluster should have a RAM license enabled. For example, if you have APAC, EMEA, and LATAM datacenters, assign the RAM License to a single datacenter, not all 3.

  1. Login to WB.
  2. Select Configuration on the navigation bar.
  3. Select Applications.
  4. Select the Workbench IO Primary application (e.g., post installation and by default this would be WB_IO_Primary).
  5. Within the Workbench IO Application Configuration panel expand the Remote Alarm Monitoring (RAM) Service section.
  6. Complete the following:
    • Check the Enabled box.
    • End User ID: enter your License Key/End User ID
    • Origin: a brief description of the geographical location (e.g., EU, APAC, AME, etc.)
  7. Verify all your entries, then click Save.
  8. [Required] Restart the Workbench IO Application Service on the respective host for the license/service to take effect.
  9. Once the service has restarted, the Customer Name and License Expiration Time fields, which are obtained via communication between WB and RAM and are Read-Only, fields will be auto-populated. This indicates a successful communication.
  10. From here on the supported WB RAM Alarms will be transitioned to the RAM Service and intelligently routed into Product Support and subsequently a Product Support Analyst, from there a case will be raised by the analyst.
  11. NOTE: Since RAM is implemented at the Genesys Account level, just 1 Workbench RAM License Key/End User ID is required per company/organization

RAM Event Visibility

Use the Alarm Console to view which Alarms were routed to the RAM Service, utilize/show the Sent to RAM Service column to visualize when the alarm was sent from WB to the RAM service.

Only Designated Contacts can request License Keys or User IDs.

NOTE: Please allow 48 hours for Product Support to process your request, after which you will receive your WB RAM license key via email.

  1. Login to My Support.
  2. Select Open Admin Case - located after selecting Manage Profile from the header.
  3. If asked, select your End User / Sold To Account combination.
  4. Populate each Mandatory Field with the required information.
  5. Add the text Alarm Monitoring License Request in the Subject line.
  6. In the Description box, provide your company public IP address.
  7. Also in the Description field, please provide a Group Email Address (e.g., support_team@mycompany.com).
    • When a case is opened as a result of an alarm, the email notification will be sent to this group email address.
    • It is required that at least one Designated Contact at your company be included in this group email.
    • The Designated Contact can be the same person who is requesting the Remote Alarm Monitoring License Key or a different Designated Contact at your company.
    • You may have more than one Designated Contact in the group email.
    • Other employees on the group email should consider requesting My Support Read-Only Access if they would like to view case details.
    • Please see the table below for details on My Support Access Levels and Privileges.
  8. Select Priority 4-Low and select case sub type Request: CC Tools License.
  9. Save your Admin case.

To prevent unnecessary alarm notifications and troubleshooting, Product Support should know in advance when you have scheduled Maintenance Windows so that we can suppress alarms during that time.

NOTE: All Maintenance Window requests, whether new or revised, must be submitted 2 working days prior to it taking effect.

To notify us of an upcoming Maintenance Window:

  1. Create an email with the following:
    • Subject: Alarm Monitoring - Maintenance Window
    • Account name
    • Site name
    • Date (MM:DD:YYY) and Time (HH:MM TIME ZONE) of maintenance
  2. Send the email to:

NOTE: Alternatively the Workbench RAM Service can be disabled via the Workbench>Configuration>Workbench IO>Remote Alarm Monitoring (RAM) Service section for the duration of the maintenance window; this would require a restart of the Workbench IO application so that the disablement would take effect.

With the Workbench Remote Alarm Monitoring (RAM) Service activated, the customers on-premise Workbench instance transitions/transmits a specific subset of Genesys Engage Critical and Major Alarms, externally, to Product Support, who will then proactively create a case and will liaise with the customer accordingly to proactively progress and resolve the issue(s); the alarms can also sent to the customers mobile device via the Genesys Care Mobile App.

RAM is an annual service available to customers, please contact your Product Support representative for further details.

NOTE: Entitlement to the RAM feature can be confirmed via your Product Support maintenance representative; if/when entitled, please see the Getting Started article.

Workbench with RAM Architecture

When RAM is also deployed, Workbench communicates over a secure RabbitMQ connection with Genesys, where additional service components are located, as shown in the figure below.

  • Genesys Customer Alarm Collector to process alarms detected in your environment
  • Genesys Care Mobile Application to notify you about alarms as they are detected
  • Product Support to route each Critical and Major alarm to a support expert, who proactively opens a case and immediately begins to troubleshoot the issue

More alarms may display within Workbench, but only the alarm types listed below will be forwarded to Genesys as part of the Remote Alarm Monitoring Service.

Alarm Name Alarm Level Alarm Description
Not Enough Disk Space Critical An application detects low disk space
Licensing violation is identified, the violation type [type] Critical Licensing violation is identified, the violation type [type]
Cannot connect to server Major Reports that the application cannot connect to the server
Cannot open port Major Cannot open port [port number] for listening, reason [reason]
Client / Server incompatibility Major Client version [number-1] is incompatible with server version [number-2]
Application terminated due to internal condition Major Application terminated due to internal condition
Host [host name] inaccessible. LCA is not listening on port [port number] Major Host [host name] inaccessible. LCA is not listening on port [port number]
Host [host name] unavailable Major A host where Genesys daemon applications are running is unavailable (turned off)
Host [host name] unreachable Major The Management Layer cannot reach the host where Genesys daemon applications are running (no route to the host)
All [total licenses] licenses are in use already, registration rejected Major All [total licenses] licenses are in use already, registration rejected
Error reading backup file '[name]': '[errtext]' Major Error reading backup file '[name]': '[errtext]'
Backup file '[name]' is corrupt Major Backup file '[name]' is corrupt
Failed to store statistics ([definition]) into backup file '[name]' (error: '[errtext]') Major Failed to store statistics ([definition]) into backup file '[name]' (error: '[errtext]')
Configuration Server Error: [error] Major Configuration Server Error: [error]
CTI Link disconnected Major Failure of connection between any T-Server and its switch

Channel Monitoring Media Files are uploaded via the Channel Monitoring - Media Files page. The uploaded media is used for the Receive Media and Send Media Call Stages of a Call Flow.

Please ensure you upload .WAV audio files with the following supported audio codecs:

  • G.711 Mu Law - pcmu/8000
  • G.711 A Law - pcma/8000

NOTE: Channel Monitoring only accepts G.711 Mu Law - pcmu/8000 and G.711 A Law - pcma/8000. Channel Monitoring will automatically detect the codec negotiated between the peers of a call and execute the necessary transcoding while sending media so that the output audio matches the codec of the call.

Add new media

Please use the following steps to upload a new Media File:

  1. Select Channel Monitoring > Media Files from the Workbench navigation bar.
    • The Channel Monitoring - Media Files page is displayed.
    • A Currently there are no Media Files uploaded message is presented if no Media Files are yet configured.
  2. Click the Upload Media File button.
  3. The Upload IVR Media File dialog is displayed.
  4. In the Category field, provide a descriptive Category name (i.e. "Support") for the media being uploaded
    • This category is used to logically group the files; if a Category already exists, it will display in the drop-down list; otherwise a new Category will be created
  5. In the Name field, provide a descriptive Name (i.e. "Welcome")
  6. For the File field, simply drag and drop the file on this field or click Select to browse to the file to be uploaded
    • NOTE: Uploaded files must be in .wav format.
  7. Click the Save button.

Use existing media

Once you have uploaded Media files, they are listed on the Channel Monitoring - Media Files page, as per the image above.

The Media File table provides the following details:

  • ID - represents an unique ID for each Media file; it is an optionally displayed column.
  • Name - represents the Name of the Media file; it is a default displayed column.
  • Category - represents the Category group (i.e. Support, Sales) to which the Media File belongs to; it is a default displayed column.
  • Duration(s) - represents the time Duration (seconds) of the Media file; it is an optionally displayed column.
  • Data Format - represents the codec (uLaw/aLaw) details of the uploaded .WAV file; it is an optionally displayed column.
  • Upload Date - represents the date/time which the Media file was uploaded to WB; it is a default displayed column.
  • Associated Call Flows - represents the Call Flow Names which use this Media file within its Call Stages; it is a default displayed column.
  • File Size (kB) - represents the size of the Media file in KB's; it is an optionally displayed column.

At the end of each row, there are options for the Media file:

  • To Edit the Media File, select the Pencil button.
  • To Playback/Listen to the Media File, select the Play button.
  • To Download the Media File locally (for backup), select Download button.
  • To Delete the Media File, select the Delete button.

Use the Show/Hide Columns button on top of the Media table to view/hide optionally displayed columns.

WARNING: Media Files should/can not be deleted if being used in an existing Call Flow within a Receive Media or Send Media Stage. To delete a Media File that is assigned to Call Flows, first unassign the Media File from the Call Flows, then delete the Media File.

The Channel Monitoring Reports page provides historical insights into the Call Flow tests, their specific behavior and results.

  1. Select Channel Monitoring > Reports from the Workbench top navigation bar.
  2. Select a Call Flow from the Call Flow Name drop-down list
    • The CM Report is generated and data is displayed for a time-range of the current day.
  3. If needed, from the Time Range drop-down, select a different timescale.
  4. If and when the Time Range is changed, click the Refresh button to update the data

CM Reports Content

Each tab in the CM Reports section provides a different view of the available data on the selected Call Flow.

  • Call Metrics
  • Stage Results
  • Call Results
  • Call Details

Call Metrics Report

The Call Metrics report uses a graph and table to describe the behavior of a Call Flow in time. The horizontal axis shows the date/time in which individual calls were executed. The vertical axis can be modified on the dropdown list to change the metric (Call Duration, Jitter, Time Wait for Agent) used to analyze the call.

The Jitter and Time Wait for Agent metrics have three thresholds that can be configured in the Alarms section of the Call Flow configuration; the threshold for each severity (Critical, Major, Minor) is shown in the graph as a different horizontal line.

  • Call Duration - The length of the call in seconds. The duration is measured from the moment Channel Monitoring starts the call (i.e., sends the first SIP invite message), until the call is finished because it either encounters an error or ends as expected.
  • Wait Time for Agent - The amount of time in minutes between the start of the transfer to an agent, and the moment when the agent answers the call.
  • Jitter - A measure of the quality of the call. In the context of Channel Monitoring, jitter is understood as “the variation of a signal with respect to some clock signal, where the arrival time of the signal is expected to coincide with the arrival of the clock signal.” In this case, the signal refers to the RTP packets downloaded to Channel Monitoring, and the clock signal is the RTP clock rate for the media stream. Jitter is measured in milliseconds. 

Stage Results Report

The report aggregates all the Stage results across the different calls for the given Call Flow. For example, if a call fails while sending audio because of an unexpected hang-up, this will increase the count for Unexpected Hang-Ups during that specific send media stage.

  • Success - All stages were executed and their results were as expected.
  • Pending Result - The call has finished and is being analyzed to determine if it failed at some point of its execution or if it’s a success. Even though most results are determined in real-time during the execution of the call, some could be delayed to the end of the call (such as media analysis).
  • Registrar Connection Failed - The SIP account used by Channel Monitoring to make calls could not connect to SIP Server. This would usually occur during the Start Call stage when Channel Monitoring tries to reach SIP Server. Possible causes include problems trying to resolve the domain name or IP address of SIP Server.
  • Account Authentication Failed - The SIP account used by Channel Monitoring to make calls could not authenticate against SIP Server using the provided credentials. This would usually occur during the Start Call stage when Channel Monitoring tries to register the account in SIP Server.
  • Unexpected Hang-up - The call was being executed and it stopped in an unexpected moment. Calls should end (hang-up) during the End Call stage and the Wait for Agent stage when the initial call is replaced because of the transfer to the agent. If the call ends at any other stage, it will be considered an unexpected hang-up.
  • No Answer - Channel Monitoring was not able to reach the target DN and complete the Start Call transaction after a given timeout. This could occur during the Start Call stage as Channel Monitoring tries to set up the call with the System Under Test.
  • Media Analysis Failed - Media received during the call did not match the expected media. A call could have various Receive Media stages where audio is received and then analyzed to determine if it matches the expected audio. This comparison produces a percentage error that, when high enough, will produce this error.
  • No Answer from Agent - A transfer to an agent was expected to occur but no provided DN answered the call before the given timeout. In this case, Channel Monitoring waits for the call to get transferred to one of the DNs provided during the call flow creation. The call might get transferred but it will only be successful if the target of the transfer is contained in the list of DNs set up by the user while configuring the Wait for Agent stage.

Call Results Report

The Call Results report presents the overall outcome for the calls placed against the Call Flow and the number of times each outcome has occurred.

  • Success
  • Pending Result
  • Account Authentication Failed
  • Unexpected Hang-up
  • No Answer
  • Other
  • Media Analysis Failed
  • Unknown
  • No Answer From Agent

Call Details Report

This report uses a tabular view to present various properties of the test calls. Each row represents the execution of a single call from the respective Call Flow. The possible execution results for a call are Success and Fail; if the call Failed, the table will show the Stage in which it failed and the reason for the error.

With the Workbench Channel Monitoring feature, you can create, schedule, and manually initiate SIP voice test calls into you're Engage platform to proactively identify potential interaction and routing issues before your customers are impacted; this feature tests voice SIP/IVR/DTMF/PROMPT menu call flows, ensuring your service is functioning as designed and raising alarms within the Workbench Alarms Console when errors are encountered.

NOTE: To utilize the Channel Monitoring feature of Workbench, your environment must have a Genesys SIP Server 8.1 or higher and DN’s configured for use as the Destination and Caller User DN's for Channel Monitoring initiated test calls.

With the Workbench Channel Monitoring feature you can:

  • Create and run SIP/IVR contact center voice test calls
  • Schedule recurring voice test calls to continuously monitor the health of the call processing environment
  • Model Call Flows through IVR menus and routing to contact center Agents
  • Visualize Channel Monitoring Call Flow Statistics
  • Control Call Flows with Edit, Stop/Start, Schedule and Manual Test capabilities
  • Generate Channel Monitoring reports on Call Flow test results, call quality (jitter), and other call test metrics
    • Reports available:
      • Call Metrics
      • Call Stage Results
      • Call Results
      • Call Details
  • Configure Channel Monitoring thresholds for various call test parameters and error conditions
    • Whenever a configured threshold is exceeded, a Workbench alarm will be generated - visible via the Workbench Alarms Console
    • These alarms can then be correlated with alarms, configuration changes to help diagnose problems that may have occurred

The following sections will guide you on:

  • Creating Channel Monitoring Call Flows and Call Stages
  • Call Flow Schedules
  • Call Flow Alarms
  • Statistic Summary
  • Uploading Media Files
  • Generating Reports

Example Call Flow

Scenario

  1. A customer calls 555-123-456 and hits Genesys SIP Server Routing Point 9999.
  2. A Welcome to Genesys Product Support prompt is played to the customer.
  3. An Is your call related to Cloud or Premise prompt is played to the customer.
  4. The customer speaks Premise.
  5. A Please enter your PIN number prompt is played to the customer.
  6. The customer enters their PIN on their DTMF keypad.
  7. The call is routed to a Contact Center Agent.

Workbench Channel Monitoring Requirements - for the above example scenario

  • A SIP Server DN to initiate the test call from Workbench to SIP Server
    • This is the "Destination" field of the Call Flow Start Call Stage - Workbench uses this DN to initiate the test call
  • The exact “Welcome to Genesys Customer Care” prompt - uploaded to Workbench via the Channel Monitoring / Media Files menu
    • Channel Monitoring only accepts G.711 Mu Law - pcmu/8000 and G.711 A Law - pcma/8000 Media Files.
    • This will be used in the Call Flow Receive Media stage - Workbench will compare and progress/fail the Call Flow accordingly based on the received media
      • These files are used to compare what is expected to be received/sent; the comparison is duration [length of media file] based, not content.
  • The exact “Is your call related to Cloud or Premise” prompt - uploaded to Workbench via the Channel Monitoring / Media Files menu
    • Channel Monitoring only accepts G.711 Mu Law - pcmu/8000 and G.711 A Law - pcma/8000 Media Files.
    • This will be used in the Call Flow Receive Media stage - Workbench will compare and progress/fail the Call Flow accordingly based on the received media
  • A “Premise” prompt - uploaded to Workbench via the Channel Monitoring / Media Files menu
    • Channel Monitoring only accepts G.711 Mu Law - pcmu/8000 and G.711 A Law - pcma/8000 Media Files.
    • This will be used in the Call Flow Send Media Stage to inpersonate a human speaking "Premise"
  • A “Please enter your PIN number” prompt uploaded to Workbench via the Channel Monitoring / Media Files menu
    • Channel Monitoring only accepts G.711 Mu Law - pcmu/8000 and G.711 A Law - pcma/8000 Media Files.
    • This will be used in the Call Flow Receive Media stage - Workbench will compare and progress/fail the Call Flow accordingly based on the received media

Workbench Channel Monitoring Call Flow Stages

Workbench Channel Monitoring Call Flow Schedule

  • The Call Flow will be tested, based on the Call Flow Schedules every day at 07:30 via the WB_IO_Primary application that’s deployed in Chennai, India

Workbench Channel Monitoring Call Flow Started

  • The Call Flow 3999_to_2002 is Started and will initiate test calls based on the associated Schedule (i.e. 07:30)

Prerequisites: Telephony > Plugin > All permission

The maximum call settings allow you to limit or expand the maximum number of combined active inbound and outbound calls that are allowed on an external trunk or on a phone trunk. On an external trunk, the maximum call settings are a per trunk setting.

The maximum call settings are configured a bit differently for BYOC Cloud trunks (BYOC Carrier and BYOC PBX) and BYOC Premises trunks (External SIP).

BYOC Cloud 

Under BYOC Cloud trunks, the setting is called Max Concurrent Calls and it consists of two options: Unlimited and Limited.

The default setting is Unlimited. Genesys has optimized the Max Concurrent Calls setting to be set to Unlimited. As such, Genesys recommends leaving the Max Concurrent Calls set to Unlimited.

However, if you or your carrier determine that setting a limit on the number of concurrent calls is required, then you should select Limited and enter a value. When selecting the Limited option, Genesys recommends that you carefully evaluate the number of calls that you want to be able to handle concurrently.

  1. Click Admin.
  2. Under Telephony, click Trunks.
  3. Click the appropriate tab: External Trunks or Phone Trunks.
  4. From the list, select the trunk you want to configure.
  5. Under the External Trunk Configuration, click General.
  6. Under Max Concurrent Calls, leave the default setting of Unlimited or select Limited to and enter a value in the box.
  7. Proceed to the Common settings section of this article.

BYOC Premises

Under BYOC Premises, the maximum call settings apply to both external trunk and phone trunk settings. You set a specific value in the box to specify the maximum number of combined active inbound and outbound calls allowed. Or you can enter a 0 (zero) in the box to configure the trunk to accept an unlimited number of calls.

Note: If you set Max Calls to 0 (zero), be sure to take into account the concurrent call capacity for your Edge devices. Setting the Max Calls to 0 (zero) does not increase the Edge’s concurrent call capacity. For more information, see Concurrent call capacity for Edge models

Note: The WebRTC phone trunk does not have a Max Calls setting.

  1. Click Admin.
  2. Under Telephony, click Trunks.
  3. Click the appropriate tab: External Trunks or Phone Trunks.
  4. From the list, select the trunk you want to configure.
  5. Under the External Trunk Configuration or the Connection Configuration section, click General.
  6. In the Max Calls box, enter the maximum number of combined inbound and outbound active calls.
  7. Proceed to the Common settings section of this article.

Common settings

  1. In the Max Call Rate box, enter the average number of calls permitted per second. 
  2. In the Max Dial Timeout box, enter the maximum delay allowed before an outgoing call attempt is aborted.
  3. In the Max Call Reason Code box, enter the SIP response code that you want the trunk to return when Max Call threshold is exceeded.

    Note: By default, a trunk returns a 503 Service Unavailable reason code if the Max Call threshold is exceeded. However, when you configure an external trunk, you can use the Max Calls Reason Code setting to specify a custom SIP response code for this condition. You can use a SIP response code in the 4xx, 5xx, or 6xx range. This allows you to configure a response code, such as 486 Busy Here, to more accurately indicate that the Max Call threshold is exceeded.
     
  4. Click Save External Trunk or Save Phone Trunk.

For more information on external trunk settings, see the External trunk settings reference.

Schedules can be assigned to Call Flows to enable recurring automated tests.

  1. Select Channel Monitoring > Call Flows from the Workbench navigation bar.
    • The existing Call Flows will be displayed in the Call Flow Summary table.
  2. To edit a particular Call Flow, select the Pencil button on that specific Call Flow row.
    • The Edit Call Flow page is displayed; the properties of the selected Call Flow will be populated accordingly.
  3. Select the Schedule tab
    • A Currently there are no Schedules associated with the Call Flow message is presented. i.e.: no Schedules are yet configured.
  4. Click Add Schedule to add a Schedule to the Call Flow
  5. From the drop-down list select the Schedule frequency; Every Minute, Hour, Day, Week, Month, Year
    • For the Every Hour, Day, Week, Month, Year frequencies further details are required such as Month, Day, Hour, Minute parameters
  6. Configure your Schedule as per your requirements
  7. Add more Schedules if needed
  8. Once complete, click the Save or Save & Close button.

Workbench Alarms can and are assigned by default to each Call Flow. If and when a Call Flow encounters an issue, a Workbench Alarm will be raised accordingly. These Channel Monitoring Alarms can be viewed via the Alarms Console and/or via Channel Monitoring Reports.

  1. Select Channel Monitoring > Call Flows from the Workbench navigation bar.
    • The existing Call Flows will be displayed in the Call Flow Summary table.
  2. To edit a particular Call Flow, select the Pencil button on that specific Call Flow row.
    • The Edit Call Flow page is displayed; the properties of the selected Call Flow will be populated accordingly.
  3. Select the Alarms tab.
    • The default settings are displayed; ALL Alarm types are enabled by default
  4. The Alarm type modification parameters being:
    • Enable
    • Disable
    • Severity
    • Threshold (if applicable)
  5. Once complete, click the Save or Save & Close button.

Call Flows are built with various Stages:

  • Start Call
  • Receive Media
  • Send DTMF Tone
  • Send Media
  • Wait for Agent
  • Wait
  • End Call

NOTE: Every Call Flow must begin with a Start Call and end with End Call . All other Stages are optional, and can be added to the Call Flow in any order for testing a specific call routing journey.

Start Call Stage

The first stage of every Call Flow, this registers the Workbench Caller User SIP account and initializes the call.

Properties

  • Destination (required):
    • The destination DN and IP address (i.e. a Genesys SIP Server RP)
    • Required Format: DN@IPaddress
  • Caller User (required).
    • The DN that will be used to place the call from Channel Monitoring (as configured in the Genesys SIP server)
    • Required Format: DN@IPaddress
  • Caller Password (required)
    • The password for the calling DN (as configured in the Genesys SIP server; enter the DN if no password assigned)
  • DTMF Method (required)
    • The method that will be used for sending DTMF tones with this Call Flow
    • Options:
      • RTP:As defined in RFC 4733
      • SIP INFO:Sends the tones using out-of-band SIP INFO messages
      • INBOUND: Audio tones are sent in the RTP stream
      • AUTO: Uses RTP DTMF, and if not available, uses INBAND DTMF
  • Start Call Timeout
    • The timeout in seconds for the initialization of the call.
      • This value can be any positive integer; if no value is entered, or the specified value is not in the correct format, the default value of 30 seconds is used.

Receive Media Stage

Listens for media to be sent from the Call Flow under test; the media that will be selected for this stage must be uploaded through the Channel Monitoring Media Files upload page.

NOTE: the comparison is duration [length of media file] based, not content.

Properties

  • Media Category (required)
    • The user-defined category to filter the media; this is created when a Media file is uploaded to Workbench Channel Monitoring and is used for organizing (i.e. Support, Sales) the media files.
  • Media To Receive (required)
    • The media that is expected to be sent by the Call Flow under test
  • Receive Timeout (required)
    • The timeout is in milliseconds; if media is not received from the Call Flow under test before this time elapses, then the test call fails and, if configured, an alarm is raised.
  • Receiving Duration (optional)
    • The duration in milliseconds of the length of the media to be received; if no value is specified, then the length of the selected media file is used.

Send DTMF Tone Stage

Sends a DTMF tone to the call routing system/flow under test.

Properties

  • DTMF Tone Sequence (required)
    • The sequence of digits/tones that will be sent to the System Under Test.
    • Required Format: at least one digit but a sequence of digits can be specified. For example: 112233

Send Media Stage

Sends media to the call routing system/flow under test; the media that will be selected for this stage must be uploaded through the media upload page. See the “Upload Media” section for additional details.

Properties

  • Media Category (required)
    • The user-defined category to filter the media; created when a Media file is uploaded to Workbench Channel Monitoring and is used for organizing (i.e. Support, Sales) the media files
  • Media To Send (required)
    • The media that is to be sent by the test call
  • Sending Duration (optional)
    • The duration in seconds of the media that will be sent to the call. If no value is specified, then the file is played in its entirety.

Wait for an Agent Stage

Waits for a response from an Agent and records the length of time before connecting with an Agent; the Stage can be configured to accept a connection from any Agent or from a white-list of appropriate contacts.

  • Wait for Agent Timeout:
    • Maximum time in minutes to wait for connecting to an Agent; if this maximum time is exceeded, the call fails and, if configured, an alarm is raised.
    • This value must be an integer; if no value is entered, or the specified value is not in the correct format, the default value of 5 minutes is used.
  • Expected Agents: (optional)
    • The list of Agent DN’s that will determine the success of a transfer if a connection is made to any Agent in the list.
    • If the list is left blank, the success of the transfer is determined by a connection to any Agent in the environment.
    • Required Format:
      • If transfers from your routing strategy to the Agent are using a Refer message, the agents should be listed as:
        • DN@agentIpAddress
      • If transfers from your routing strategy to the Agent are completed via a Re-Invite, the agents should be listed as:
        • agentIpAddress
    • If you are unsure which transfer method to use, include entries for both Refer and Re-Invite transfer formats.

Wait Stage

Waits for a specified period of time (milliseconds) before proceeding to the next stage of the Call Flow.

Properties

  • Wait Duration: (required)
    • The time in milliseconds for the Stage to wait

End Call Stage

Terminates/ends the call when the Call Flow reaches this stage; this Stage is required/fixed as the final stage for all Call Flows.

Stages and Media Files

Before executing a call, Channel Monitoring extracts the required audio files from the database and stores them on a directory located in the <Workbench Installation directory>/cm_cache path; these audio files are the items configured on the Send Media and Receive Media stages.

NOTE: In time, this directory can grow if there are a high number of different media files and Call Flows. Genesys recommends that users periodically check this directory and delete all of its contents if space is needed. This is a safe operation as long as no Call Flow that needs one of these audio files is executing at the same time as the deletion.

Channel Monitoring (CM) Call Flows are the primary templates for testing voice call routing, be that a simple call to a SIP DN or a call that navigates through an IVR with DFMT and speech recognition functionality and finally connecting to a contact center agent.

A Channel Monitoring Call Flow defines the different Stages in which a call will execute against the system that is being tested.

  1. Select Channel Monitoring > Call Flows from the Workbench top navigation bar.
  2. Click the Add Call Flow to create a new Call Flow.
  3. Enter a unique name in the Call Flow Name field.
  4. Select the Call Flow Application from the dropdown list.
    • This is the Workbench IO application that will initiate the CM test calls
    • The Data-Center field will be auto populated based on the Data-Center of the WB IO application
  5. The mandatory Start Call and End Call Stages are pre-populated in the Call Flow Stages list.

Build a Call Flow

  1. To build a Call Flow that will test your specific routing requirement, simply drag and drop a Stage from the Stage Palette on the left into the Call Flow Stages list window.
  2. From within the Call Flow Stages list, click on a specific Stage to expand, display, and edit its properties.
  3. Call Stages can be reordered within the list by dragging them to the desired location.
  4. Perform the necessary Call Flow modifications to match the desired test of your call routing.
  5. Click the Save or Save & Close.

Edit a Call Flow

  • Cancel - cancels Call Flow Edit mode and redirects back to the Channel Monitoring Call Flow Summary page
  • Save - saves the current configuration and the user remains in edit mode
  • Save & Close - saves the current configuration and redirects the user back to the Channel Monitoring Call Flow Summary page
  • Green Tick - indicates this Stage has been fully configured
  • Note with Pencil - indicates this Stage has not been fully configured
    • As such this Call Flow will have a Draft State as opposed to a Ready State
  • Copy - copies (below) this Stage
  • Red X - deletes this Stage

NOTE: Every Call Flow requires its own dedicated SIP Server DN. For example if you plan to test 5 x Genesys SIP/GVP call flows then you will need 5 x SIP Server DN's for the Channel Monitoring Start Call Stage and its associated Caller User property.

The Channel Monitoring Call Flow Summary page enables real-time visibility of Call Flows, their respective statuses and also Call Flow Statistics:

  • Post installation there will be no Call Flows displayed in the Call Flow Summary table.
  • Follow the CM - Add a New Call Flow section to create your first Channel Monitoring Call Flow
  • Once you've created a Call Flow it will appear in the Call Flow Summary table

The Console provides a real time data-table of Call Flows and their status; the Call Flow Summary table provides the following functionality:

  • Columns
    • Name - the generation Date/Time of this Change event
      • NOTE: Timestamps are stored in UTC and translated to local time based on the Users Browser Time-Zone
    • CM Appl. - the particular Object of this Change event
    • State - the Item of this Change event
    • Status - the new value of this Change event
    • Last Run - the User who actioned the change
    • Schedules - the internal ID of this Change event
    • Data-Center - the Data-Center this Call Flow is associated with
  • Export
    • PDF or XLS
  • Column Visibility
    • Show/Hide columns
  • Normal/Full-Screen
  • Column Reordering
    • move columns left or right within the data-table
  • Column Search/Filter
    • Filter data-table events based on DateTime, drop-down or text searches
  • Column Sort
    • Name and Last Run columns

At the end of each Call Flow row there are options to:

  • Edit the Call Flow, select the Pencil button.
  • Start/Stop the associated Call Flow Schedule, select either the Play or Stop button.
    • NOTE: the Call Flow needs to be in the Ready state, all config complete, to be able to Start the Call Flow Schedule
  • Initiate a Manual Call for the respective Call Flow - the Phone button.
    • NOTE: the Call Flow needs to be in the Ready state, all config complete
  • Delete the Call Flow, select the Close button.
    • NOTE: the Call Flow will be permanently deleted; no Media Files can be associated with a Call Flow to enable deletion

The Call Flow Summary page also provides:

  • Export the Call Flow summary list to XLS or PDF the Download button.
  • Show/Hide Call Flow table columns, select the Eye button.
  • Expand/Collapse (full-Screen On/Off) the Call Flow table, select either the Expand or Collapse arrow button.

NOTE: If/when Workbench Data-Center nodes/Clusters are synchronized, to form a distributed Workbench deployment, the Channel Monitoring feature is holistic, whereby, Channel Monitoring Call Flows, Media Files and Reports can be managed irrespective of the local Workbench Data-Center the user is logged into.

  1. Go to Channel Monitoring > Call Flows from the Workbench navigation bar.
  2. The existing Call Flows will be displayed in the Call Flow Summary table.
  3. To edit a particular Call Flow, select the Pencil button on that specific Call Flow row.
  4. The Edit Call Flow page is displayed. The properties of the selected Call Flow will be populated accordingly.
  5. Click on any Stage or field to edit.
  6. Perform the necessary modifications.
  7. Click the Save or Save & Close button.

NOTE: A Call Flow with a Status of Running cannot be deleted; please stop the Call Flow Schedule first to commence deletion of the Call Flow.

  1. Select Channel Monitoring > Call Flows from the Workbench navigation bar.
    • The existing Call Flows will be displayed in the Call Flow Summary table.
  2. To delete a particular Call Flow, select the Delete Call Flow button on that specific Call Flow row.
    • A Warning confirmation dialog is presented
    • The deletion of the Call Flow and its associated data is permanent
  3. Either click Cancel to avoid deleting the Call Flow or...
  4. Check the Impact(s) Understood and Accepted dialog and click the Delete button to continue

Architecture prior to Data-Center sync 

The previous Workbench Installation sections in this document result in a Workbench instance/Cluster deployed at a given Data-Center. For example:

Single node Workbench deployed in APAC

  • The Engage Master Configuration Server is deployed in APAC
  • An Engage Distributed Solution Control Server (SCS) is deployed
  • Engage Alarms and Changes from both Data-Centers are being ingested into the APAC Workbench

You have deployed a single node Workbench in EMEA

  • An Engage Configuration Server Proxy is deployed in EMEA
  • An Engage Distributed Solution Control Server (SCS) is deployed
  • Alarms and Changes from both Data-Centers are being ingested into the EMEA Workbench

From a Genesys Engage perspective the APAC and EMEA Data-Centers are integrated via CS Proxy and Distributed SCS architecture

At this stage, the 2 x Workbench deployments are separate from each other, albeit they're integrated to the same Engage platform and you wish to form an holistic, metric data ingestion optimized, distributed Workbench architecture

Check Workbench Component Status at each Data-Center

NOTE

  • Workbench Versions on ALL Nodes and at ALL Data-Centers should be running the same release - i.e. do NOT mix 9.0.000.00 with 9.1.000.00.
  • With the below planning considered, please progress to the next Data-Center Synchronization - Configuration article to begin the process.

Prior to commencing a Workbench Data-Center Synchronization, please ensure the following components, at each Data-Center, have a Up/Green status:

  • Workbench IO
  • Workbench Elasticsearch
  • Workbench ZooKeeper
  • Workbench Agent (running on the respective Workbench Hosts that are going to be synched)

WARNING

  • Please double-check the Workbench components above, at each Data-Center, have a Up/Green status before initiating a Workbench Data-Center Sync
  • Do not change the Elasticsearch Port (i.e. 9200) post Data-Center synchronization - if the default requires change, change before Data-Center Sync
  • Do not change the ZooKeeper Port (i.e. 2181) post Data-Center synchronization - if the default requires change, change before Data-Center Sync

Pre formation

  1. Go to Configuration Page > Data-Center section then click the + button to display the synchronization form.
         
  2. Complete the mandatory (*) fields in the prompt, as well as the Remote Zookeeper Hostname and Remote Zookeeper Port fields. .
         
    • NOTE: If authentication is enabled, you must enter the credentials.
  3. Click the Sync.
    •  WARNING: Wait for the synchronization to complete.
  4. If your remote Zookeeper address is valid and able to connect, it will start progress synchronization and display the progress status on the screen.
  5. Once synchronization completes, click Close.
         
  6. The page is now populated with the synchronized remote Data-Center information.
  7. Check the new/additional remote Workbench Data-Center Host(s) are present in Workbench\Configuration\Hosts.
    • In the example below, CC-APP-DEC-DEMO-3 is the remote EMEA Data-Center host:
           
  8. Check the number of Data-Centers and their names are present in Workbench\Configuration\Overview.
    • In the example below, we have 2 x Data-Centers - APAC (the initiator) and the remote EMEA Data-Center:
          WB 9.1 DC Config Overview Post Sync.png
  9. Repeat for any additional deployments.

Post formation

WARNING

  • The following folders must be deleted:
    • Windows
      • <WB_HOME_FOLDER>\Karaf\resources\windows\wbagent_9.1.100.00_installscripts
    • Linux
      • <WB_HOME_FOLDER>/Karaf/resources/linux/wbagent_9.1.000.00_installscripts
  • When forming a Workbench Cluster, for example adding a Workbench Node 2 or Node 3, or Node N, on completion of forming the Workbench Cluster, the Workbench IO (i.e. WB_IO_Primary) Application now needs to be restarted to regenerate the correct Workbench Agent Remote JSON configuration file”

Renaming a Workbench Data-Center

WARNING

  • The following folders must be deleted:
    • Windows
      • <WB_HOME_FOLDER>\Karaf\resources\windows\wbagent_9.1.100.00_installscripts
    • Linux
      • <WB_HOME_FOLDER>/Karaf/resources/linux/wbagent_9.1.000.00_installscripts
  • If/when a Workbench Data-Center is renamed, the Workbench IO (i.e. WB_IO_Primary) Application needs to be restarted to regenerate the correct Workbench Agent Remote JSON configuration file”

Renaming a Workbench Agent Remote Data-Center

WARNING

  1. Once renamed, if an existing host requires a Workbench Agent Remote re-installation, the newly generated binaries in the following folder must be copied prior to running the installer or executable:
    • Windows
      • <WB_HOME_FOLDER>\Karaf\resources\windows\wbagent_9.1.100.00_installscripts’
    • Linux
      • <WB_HOME_FOLDER>/Karaf/resources/linux/wbagent_9.1.100.00_installscripts

  1. Navigate to Configuration > Applications > WB Elasticsearch > 8.Workbench Elasticsearch Authentication.
  2. Configure the following fields:
    • Enabled: Click this checkbox to enable Elasticsearch Authentication.
    • Username: Provide an Elasticsearch Username (i.e. "WB_ES") which be be used for the Authentication Username Credential.
    • Password: Provide an Elasticsearch Password (i.e. "my_p@ssword123") which be be used for the Authentication Username Credential.
      • NOTE: The password fields include an eye icon button that allows you to see the plain text when entering the password.
    • Confirm password: Provide the Elasticsearch Password (i.e. "my_p@ssword123") again to ensure accuracy.
      • NOTE: The password fields include an eye icon button that allows you to see the plain text when entering the password.
  3. Click Save.
  4. Workbench Elasticsearch Authentication will now be enabled.
  5. Workbench components will be restarted.
  6. Workbench components will connect to the respective Elasticsearch component(s) using the provided credentials.
  7. Workbench Elasticsearch Authentication can be disabled by un-checking the Enabled checkbox and clicking Save.


Elasticsearch authentication provides improved security for the back-end Workbench storage, essentially requiring a username and password to access the Elasticsearch data.

Elasticsearch authentication is not enabled by default and can be enabled through the Workbench UI post installation.
Elasticsearch handles authentication/authorization by using File-based user authentication. All the data about the users for the file realm is stored in two files on each node in the cluster: users and users_roles. Both files are located in Elasticsearch config directory and are read on startup.

The users and users_roles files are managed locally by the node and are not managed globally by the cluster. This means that with a typical multi-node cluster, the exact same changes need to be applied on each and every node in the Workbench cluster, as such, any change from the Workbench UI will be reflected automatically in all other nodes in the cluster.

Pre-Requisites

  • The customer must generate the respective Host/Server Certificates.
  • TLS settings should be configured on the Workbench Hosts Objects that are running the Elasticsearch component (e.g., WB_Elasticsearch_Primary, WB_Elasticsearch.2, WB_Elasticsearch.3.).
  • A copy of Host TLS Certificate must be copied to the respective Elasticsearch configuration directory (e.g., /opt/Genesys/Workbench_9.x.xxx.xx/ElasticSearch/config) in all Workbench Elasticsearch nodes.).

Limitations/Considerations

WARNING

  • All Workbench components will be restarted post enabling Elasticsearch Authentication, therefore Workbench Application statuses will be Red/Down for up to ~3 minutes.
  • Elasticsearch Authentication can be enabled either pre of post Cluster formation; configurations are sync'd automatically to the Additional Elasticsearch nodes when enabled via the Primary Elasticsearch node

Recommended Procedure

Recommended procedure to enable Workbench Elasticsearch Authentication (Elasticsearch Cluster):

  • Install all Workbench Elasticsearch nodes
  • Enable TLS on each Workbench node
  • Form Workbench Elasticsearch Cluster
  • Enable Elasticsearch Authentication

The Workbench installation uses the Ant Installer component, if during the Workbench installation a Network Account install is selected, the Ant Installer prints the username and password details to the ant.install.log file.

NOTE: Genesys recommends the ant.install.log file be manually edited and the password be masked/deleted.

Overview

A Workbench Data-Center(s) is a logical concept to categorize and optimize the respective Workbench Hosts, Applications and ingested data for event distribution, visualization context and filtering purposes, whereby:

  • Each Workbench host, and the respective applications within that host, are assigned to a Data-Center, this is mandatory
  • The Data-Center name is entered during Workbench Primary Node installation
  • The Data-Center name is case-sensitive and a max of 10 characters

Post Workbench Data-Center sync benefits

Workbench Data-Center synchronization forms a distributed Workbench architecture whereby:

  • Engage Alarms can be cleared holistically from any Workbench at any Data-Center
  • Metric data (i.e. CPU/RAM/DISK/NETWORK) from remote Workbench Agents (i.e. deployed on Genesys Application hosts such as SIP, URS, FWK etc) can be ingested into the local Workbench Data-Center instance/Cluster
    • i.e. provides network traffic optimization
  • WB Configuration can be edited/view holistically
    • WB Configuration is based on the Workbench Master – the Workbench Master being the initiator of the WB to WB Data-Center Sync
      • For simplicity, Genesys recommends your Workbench Master is the Workbench deployed at the same Data-Center as the Master Configuration Server
      • Use this Workbench Master as the initiator when synching Workbench Data-Centers
  • Channel Monitoring (CM) Call Flows, Media Files and Reports can be viewed holistically
  • CM Call Flows and Media Files can be added/edited/deleted holistically

Post Workbench Data-Center sync limitations

  • Dashboards and Visualizations from either Data-Center do NOT sync to the other
    • i.e. Post Data-Center Sync, the "APAC" Dashboards will NOT be synched to the "EMEA" Data-Center, and vice-versa
  • Users can ONLY view Metric data from the Data-Center they are logged into
    • i.e. Users cannot log into the APAC Data-Center and view Metrics from the "EMEA" and "LATAM" Data-Centers
  • Only Active Workbench Alarms will be sync’d during the Data-Center to Data-Center syncing process
  • Only Workbench Changes will be sync’d during the Data-Center to Data-Center syncing process based on the Retention Period configured on the WB Master
  • Channel Monitoring Call Flows metadata is sync – not the actual CM Call Flow Object - this enables holistic managment of a Call Flow, irrespective of its Data-Center
    • This is by design, a Channel Monitoring Call Flow is associated with a WB IO application at only 1 x Data-Center

Workbench 9.1 adds a Metric data ingestion feature that enables observability of host and process CPU, Memory, Disk and Network metric data, providing rich insights and analysis capability into host and process metric utilization, performance and trends.

For example, the Workbench Agent Remote component can be deployed on Engage hosts, for example, SIP/URS/STAT or Framework (CS, SCS, MS, DBS etc) Genesys Application Hosts.

Workbench Agent and Workbench Agent Remote

NOTE

  • Workbench Agent 8.5 is ONLY for LFMT
  • Workbench Agent 9.x is ONLY for Workbench 9.x Hosts
  • If/when Workbench and LFMT is deployed, both Workbench Agents 8.5 and 9.x would be needed on each remote host
    • The Workbench Agent 8.5 would be required for LFMT to collect log files from the remote hosts (i.e. sip, urs, gvp etc)
    • The Workbench Agent 9.x would be required for Workbench ingestion of data from the remote hosts (i.e. sip, urs, gvp etc)
  • Workbench Agent Remote (WAR) 9.x is ONLY deployed on remote Genesys Hosts such as SIP, URS, GVP etc - this components sends Metric data to the Workbench 9.x Server/Cluster
  • It's recommended not to change any Workbench Agent Remote configuration from the default settings, due to a limitation that when upgrading Workbench, all the Workbench Agent Remote configuration will be reverted back to the default settings.

Architecture

Cluster with a single Data-Center

WAR Upgrade.png

NOTE

  • Workbench Agent Remote has an Auto-Upgrade feature, thereby the Workbench Agent Remote is a one time install with subsequent upgrades being autonomous (upgrade check performed at 02:00 by default).

Cluster with a multi Engage Data-Center

WB 9.1 Arch Cluster MultiDC 2021.png

NOTE

  • Users can only visualize Dashboard Metric data based on the Data-Center they're logged into
  • .i.e. A User logged into the APAC Workbench instance/Cluster cannot view Metric data for EMEA - they need to log into the EMEA Workbench instance/Cluster

Components - Run-time

The Workbench Agent Remote Run-time components consist of:

  • Workbench Agent Remote - executable installed as a Service
    • Start a HTTP Server for WB_IO_Primary communication
    • Sends initial configuration of the Workbench Agent Remote to Workbench ZooKeeper
    • Schedules an upgrade if/when an upgrade notification is received from WB_IO_Primary
    • Downloads any new Workbench Agent Remote package, from WB_IO_Primary
    • Validates the checksum of the downloaded package
  • Workbench Agent Metricbeat - executable installed as a Service
    • Transmits Host and Application Metric data to the Workbench instance/Cluster
    • Metric data is visible via Workbench Dashboards and Visualizations
  • Workbench Agent Updater - executable installed as a Service
    • Installs and starts the Metricbeat Service
    • Installs any new updates on the Workbench Agent Remote or the Metricbeat Services.
    • If the upgrade fails, a rollback to the previous version of the Workbench Agent Remote is performed

Components - Installation

The Workbench Agent Remote Installation components consist of:

  • installer.exe (Windows) / installer (Linux)
    • This executable file initiates the silent installation of the Workbench Agent Remote component on the respective remote host
  • install_config.json (both Windows and Linux)
    • This file:
      • contains mandatory configuration used by the installer/uninstall files
      • is auto generated when the Workbench Primary Node is installed
      • can be edited - i.e. change the installtion folder or ports
      • should be edited if/when certain Workbench component configuration is changed

The above components are stored on the Workbench Primary Host/Node, within directories:

Windows

  • <WB_HOME_FOLDER>\Karaf\resources\windows\wbagent_9.1.100.00_installscripts directory (Windows)
    • i.e. C:\Program Files\Workbench_9.1.100.00\Karaf\resources\windows\wbagent_9.1.100.00_installscripts

Linux

  • <WB_HOME_FOLDER>/Karaf/resources/linux/wbagent_9.1.100.00_installscripts directory (Linux)
    • i.e. /opt/Genesys/Workbench_9.1.100.00/Karaf/resources/linux/wbagent_9.1.100.00_installscripts

Installation pre-requisites

WARNING

  • Ensure the Workbench IO application (i.e. WB_IO_Primary is up and running before running the Workbench Agent Remote installer
    • if the WB_IO_Primary application is down, the WAR components will be installed but the associated configuration will be incomplete, resulting in a need to uninstall/install
  • Ensure you open network ports 9091 and 5067, from a firewall perspective, on any remote Host that will be running the Workbench Agent Remote component.

Installing WAR

Windows

  1. Copy the 2 x Pre-Install Workbench Agent Remote Windows component files detailed above:
    • from the <WB_HOME_FOLDER>\Karaf\resources\windows\wbagent_9.1.100.00_installscripts directory on the Workbench Primary Host/Node
    • to C:\tmp\Workbench_Agent_Remote\ (or equivalent) directory of the remote Windows Host(s) - i.e. the Genesys Engage SIP Server Host
    • cd to C:\tmp\Workbench_Agent_Remote\
  2. Run installer.exe (cmd) or .\installer.exe (PS) as Administrator
    • The output/progress/result from running the executable can be found in agent_install.log
  3. The above action has created 3 Windows Services:
    • Genesys Workbench Agent Remote
    • Genesys Workbench Metricbeat
    • Genesys Workbench Agent Updater

WARNING

For each Workbench Agent Remote installation, the Heartbeat component is restarted, this will affect the status displated of ALL Workbench components - therefore, post Workbench Agent Remote installation, please wait several minutes for the Workbench Heartbeat component to restart and status to recover.

WB 9.1 WBAR Win Services.png

Example

WB 9.1 WBAR Win New Object2.png

Linux

  1. Copy the 2 x Pre-Install Workbench Agent Remote Linux component files detailed above:
    1. From the <WB_HOME_FOLDER>/Karaf/resources/linux/wbagent_9.1.100.00_installscripts directory on the Workbench Primary Host/Node
    2. To the home/genesys/tmp/Workbench_Agent_Remote (or equivalent) directory of the remote Linux Host(s) - i.e. the Genesys Engage SIP Server Host
    3. cd to home/genesys/tmp/Workbench_Agent_Remote
  2. Run sudo ./installer (as a sudo privileged user)
  3. The above action has created 3 Linux Services:
    • Genesys_Workbench_Agent_Remote
    • Genesys_Workbench_Agent_Updater
    • Genesys_Workbench_Metricbeat
  4. List/manage the Genesys services using:
    • $ systemctl list-units --type=service --state=active | grep Genesys
    • $ systemctl status Genesys_Workbench_Agent_Remote
    • $ systemctl stop Genesys_Workbench_Agent_Remote
    • $ systemctl start Genesys_Workbench_Agent_Remote
  5. The above Linux Services can be located in /etc/systemd/system

WARNING

  • For each Workbench Agent Remote installation, the Heartbeat component is restarted, this will affect the status displated of ALL Workbench components - therefore, post Workbench Agent Remote installation, please wait several minutes for the Workbench Heartbeat component to restart and status to recover.

Example

WB 9.1 WBAR Linux New Object.png

Workbench Agent Remote Configuration File


The install_config.json contains settings required to successfully install Workbench Agent Remote on a remote Host, these settings are automatically generated during the installation of the Workbench Primary Node/Host.

See # comments inline regarding modifications that may be required to the install_config.json file.

Example install_config.json:

{
"updater" : {
"name" : "WB_Agent_Updater_9.1.100.00",
"executable" : "/opt/Genesys/Workbench_9.1.100.00/updater",
#change the above if a different installation path is required
"displayName" : "Genesys Workbench Agent Updater 9.1.100.00",
"description" : "Genesys Workbench Agent updater service for PureEngage environments",
"arguments" : [ "-rootPath=/opt/Genesys/Workbench_9.1.100.00", "-logPath=/opt/Genesys/Workbench_9.1.100.00/logs" ], 
#change the above if a different installation path is required
"yamlFile" : null
},
"root_folder" : "/opt/Genesys/Workbench_9.1.100.00", 
#change the above if a different installation path is required
"wb_io_ip" : "GEN-WB-1",
"wb_io_port" : "8182", 
# change if the Workbench IO is changed from the default 8181
"wb_io_https_port" : "8182", 
#change the above if the Workbench IO is changed from the default 8181
"logstash_host" : "GEN-WB-1",
"logstash_port" : "5048", 
#change the above if the Workbench Logstash is changed from the default 5048
"datacenter_name" : "APAC", 
# change if the respective Data-Center is changed
"datacenter_id" : "2e048957-b9f1-463b-84bd-116cdf494de2",
"update_hour" : "02:00", 
#the property above should not be modified manually in the file. If needed, you can modify it in Workbench UI, in the configuration properties of the WAR application
"zookeeper_hosts" : [ "GEN-WB-1:2181" ],
"local_http_port" : "9091", 
#change the above if the Workbench Kibana is changed from the default 9091
"local_https_port" : "8443", 
#change the above if the Workbench Kibana is changed from the default 8443
#the properties below should not be modified manually, doing this will cause Workbench Agent Remote (WAR) to behave unexpectedly
"tls_server_cert_file" : "na",
"tls_server_key_file" : "na",
"tls_ca_cert_file" : "na",
"enable_tls" : false,
"enable_mutual_tls" : false,
"update_file_name" : "wbagent_9.1.100.00.tar.gz",
"update_file_checksum" : "166ca35224bff0194c1d94c40e216a6ac249eca3284f92bbad39811528c95678",
"download_endpoint" : "wb/upgrade/upgrade-download",
"notify_endpoint" : "wb/upgrade/notify"
}

Post installation

Validate the installation

Ensure the Workbench Agent Remote Services below are running:

  • Genesys Workbench Agent Remote
  • Genesys Workbench Metricbeat
  • Genesys Workbench Agent Updater

If the above Services are not present, check the agent_install.log file for the highlighted terms below:

time="2020-MM-DDT13:48:34Z" level=info msg="Available disk space meets requirements for the agent installer" available_MB=145032 min_MB_needed=100
time="2020-MM-DDT13:48:34Z" level=info msg="Found installation configuration file"
time="2020-MM-DDT13:48:34Z" level=info msg="Configuration loaded"
time="2020-MM-DDT13:48:34Z" level=info msg="Downloading file from: http://WB-1:8182/wb/upgrade/upgrade-download?file=wbagent_9.1.100.00.zip"
time="2020-MM-DDT13:48:34Z" level=info msg="Downloading file to path: C:/Program Files/Workbench_9.1.100.00\\wbagent_9.1.100.00.zip"
time="2020-MM-DDT13:48:34Z" level=info msg="Downloaded compressed file successfully"
time="2020-MM-DDT13:48:37Z" level=info msg="Files successfully extracted, compressed file:C:/Program Files/Workbench_9.1.000.00\\wbagent_9.1.100.00.zip"
time="2020-MM-DDT13:48:37Z" level=info msg="Creating updater service..."
time="2020-MM-DDT13:48:37Z" level=info msg="Done creating updater service"
time="2020-MM-DDT13:48:37Z" level=info msg="Installing updater service named: Genesys Workbench Agent Updater 9.1.000.00"
time="2020-MM-DDT13:48:37Z" level=info msg="Starting updater service..."
time="2020-MM-DDT13:48:37Z" level=info msg="Updater service status: RUNNING"

Metric data transmission

Post installation, Workbench Agent Remote will send Metric (Host/Application CPU/RAM/DISK/NETWORK) data to the respective local Data-Center Workbench instance/Cluster

  • Host Metric Data
    • Host CPU and RAM Metrics - enabled by default - cannot be disabled
    • Host Disk, Network and Uptime Metrics can be enabled/disabled
    • The default Host Metric transmit frequency to the respective Workbench instance/Cluster is 60 seconds
  • Application/Process Metric Data
    • Application/Process can be transmitted based on Top 10 or Specific Process Names (i.e. "metricbeat.exe")
    • The Top 10 (CPU/RAM) Application/Process Metrics
    • Application/Process Metrics are summarised by default
    • The default Application/Process transmit frequency to the respective Workbench instance/Cluster is 60 seconds

NOTE

  • Any changes to Sections 5 Host Metrics and 6 Application Metrics of the Workbench Agent Remote configuration does NOT required a restart of Services; the changes are dynamic.

Auto upgrade

Workbench Agent Remote has an auto-upgrade capability, therefore installing Workbench Agent Remote is a one time exercise; when new Workbench or Workbench Agent Remote versions are released, the respective Workbench Agent Remote components can be automatically upgraded based on receiving an upgrade notification from the Workbench IO application.

Each Workbench Agent Remote application installed on a remote, non Workbench host:

  • Will receive a notification from the Workbench IO application if/when a new Workbench Agent Remote component is available for upgrade
  • Has Auto Upgrade enabled by default
  • Checks the hash of the downloaded file to validate it matches the original upgrade notification received from Workbench IO
    • If it matches the upgrade if initiated based on the Upgrade Time value
  • The upgrade on the remote Host by default will occur at 02:00 - change via Section 3. Auto Upgrage - Upgrade Time value if required
  • The Section 3. Auto Upgrage - Upgrade Time value can be changed for each Workbench Agent Remote application
    • Providing flexibility as to when the auto upgrade check/action will be initiated.

Example

  1. In Workbench Configuration > Applications, for each of the Workbench Agent Remote (WAR) applications, set the desired upgrade time (default is 02:00).
    • The upgrade time is relative to the destination machine where WAR is installed
      • e.g. if the WB time is Eastern time-zone and WAR machine is in Pacific time-zone, the time must be in Pacific time-zone.
  2. Delete (archive to a different folder) any previous/existing Workbench Agent Remote (WAR) package (wgagent_9.1.100.00.zip or wbagent_9.1.100.tar.gz) files within
    • <WB_HOME_FOLDER>/Karaf/resources/windows/data for Windows
    • <WB_HOME_FOLDER>/Karaf/resources/linux/data for Linux
  3. Copy the new WAR package (.zip or .gz) file to
    • <WB_HOME_FOLDER>/Karaf/resources/windows/data for Windows
    • <WB_HOME_FOLDER>/Karaf/resources/linux/data for Linux
  4. The checksum for the new package will be calculated (this will take a few minutes)
  5. After the checksum is calculated, an upgrade notification is sent to Workbench Agent Remote (WAR)
  6. Once Workbench Agent Remote (WAR) receives the notification, it will schedule the upgrade
  7. The Workbench Agent Remote (WAR) upgrade will automatically occur based on the upgrade time
  8. The Workbench Agent Remote (WAR) Application will be automatically restarted
  9. The Workbench Agent Remote (WAR) will now be running the updated package

NOTE

  • Please note that if the Upgrade Time is updated after the new WAR package is copied, the time change will take effect based on the old time value and not the new updated time
  • Workbench upgrades starting from version 9.1 will automatically trigger the upgrade of any WAR components that existed prior to the Workbench upgrade.

Set the update time

WB 9.1 WBAR Auto Upgrade.png

Auto upgrade sequence diagram

The diagram below details the Workbench agent Remote installation and upgrade functions:

WB 9.1 WBAR Install UML.png

Uninstall WAR

Windows

  1. On the respective Remote Host(s) - i.e. UK-SIP-1
  2. cd to C:\Program Files\Workbench_9.1.100.00\ (or equivalent) directory
  3. Run uninstall.exe (cmd) or .\uninstall.exe (PS) as Administrator
  4. This will remove the 3 x Windows Services:
    • Genesys Workbench Agent Remote
    • Genesys Workbench Metricbeat
    • Genesys Workbench Agent Updater
  5. An uninstall.log is also created detailing the uninstallation progress.

NOTE

  • Workbench Agent Remote will no longer send Host and Application Metrics to the Workbench instance/Cluster, therefore Dashboard visualizations will not present any data for the respective host(s) that have had Workbench Agent Remote uninstalled.

WARNING

  • Post Workbench Agent Remote uninstall, the uninstall.exe and uninstall.log files will need manual deletion.

Linux

  1. On the respective Remote Host(s) - i.e. UK-SIP-1
  2. cd to /opt/Genesys/Workbench_9.1.100.00/ (or equivalent) directory
  3. Run sudo ./uninstall (as a sudo privileged user)
  4. This will remove the 3 x Linux Services:
    • Genesys_Workbench_Agent_Remote
    • Genesys_Workbench_Metricbeat
    • Genesys_Workbench_Agent_Updater
  5. An uninstall.log is also created detailing the uninstallation progress.

NOTE

  • Workbench Agent Remote will no longer send Host and Application Metrics to the Workbench instance/Cluster, therefore Dashboard visualizations will not present any data for the respective host(s) that have had Workbench Agent Remote uninstalled.

WARNING

  • Post Workbench Agent Remote uninstall, the uninstall and uninstall.log files will need manual deletion

Security

Login Authentication Requirement

  • Workbench uses Genesys Configuration Server authentication.
  • To login to Workbench, each user needs a valid Configuration Server User Name and Password with Read and Execute permissions to use the Workbench Client (e.g., WB9_Client) application.

Network

Data ingested by Workbench (including Alarm, Changes, Channel Monitoring and Metric events) from the Genesys Engage platform is stored locally in the customer environment; the customer is responsible for protecting this data.

Outbound Network Connectivity Requirements (Remote Alarm Monitoring (RAM) Subscribers)

In some customer environments, outbound network connectivity is restricted. If you subscribe to the Remote Alarm Monitoring (RAM) service from Genesys Care, you will need to enable minimal connectivity for Workbench to send alarms from the Remote Alarm Monitoring service to Genesys for processing. This processing includes routing alarms to Genesys support analysts and displaying alarm notifications in the Genesys Care Mobile App.

The outbound connectivity should allow connectivity from the Workbench host/server to "alarm.genesys.com" (208.79.170.12) on port 443; you may need to engage your networking or security team to enable this connectivity.

NOTE: This Remote Alarm Monitoring connectivity requirement only applies if you are using the Remote Alarm Monitoring Service with Workbench.

Windows

The Workbench installation files will be contained in the Genesys My Portal obtained downloaded compressed file.

See also Downloading Workbench.

NOTE

  • Workbench requires the installation of a Primary Node at each and every Data-Center.
  • The Workbench Primary Node must be installed prior to installing Workbench Additional Nodes.
  • Workbench ships with its own pre-bundled Java distribution, OpenJDK11; all Workbench components will be configured through the installation to use this Java distribution and should not affect any other components that may be installed on the host.
  • The Workbench installation uses the Ant Installer component, if during the Workbench installation a Network Account install is selected, the Ant Installer prints the username and password details to the "ant.install.log" file. Genesys therefore recommends, post installation, at a minimum the "ant.install.log" file be manually edited and the password be masked/deleted.
  • Use an Administrator level account when running the Workbench install.bat file.
  • Genesys does not recommend installation of its components via Microsoft Remote Desktop
  • If the Workbench installation is cancelled mid completion, please ensure the Workbench install directory is cleaned/purged prior to attempting another install

WARNING

  • Workbench uses the Hostname for component configuration
  • Please ensure hostname resolution between Workbench and Engage Hosts is accurate and robust
  • If the Workbench Hosts have multiple NIC's, please ensure the Hostname resolves to the desired IP Address prior to Workbench installation

How to install Workbench 9.x.xxx.xx

  1. Extract the downloaded Workbench_9.x.xxx.xx_WINDOWS.zip compressed zip file.
  2. Navigate into the Workbench_9.x.xxx.xx_WINDOWS\ip\windows folder.
  3. Extract the Workbench_9.x.xxx.xx_Installer_Windows.zip compressed zip file.
  4. Navigate into the Workbench_9.x.xxx.xx_Installer_Windows folder.
  5. Open a Command/Powershell Console As Administrator and run install.bat.
  6. Click Next on the Genesys Care Workbench 9.x screen to start the Workbench installation.
  7. Review and agree to the Genesys Terms and Conditions to continue.
  8. Select New Installation on the Installation Mode screen.
  9. Select the Installation Type.
  10. The next Workbench Installation Type screen contains multiple Workbench installation options; Workbench contains multiple components:
    • Workbench IO
    • Workbench Agent
    • Workbench Elasticsearch
    • Workbench Kibana
    • Workbench Logstash
    • Workbench Heartbeat
    • Workbench ZooKeeper
  11. Select Primary Node (given we're installing the first, Primary, Workbench node/components).
  12. Next, choose between the Default or Custom installation type.
    • For the Default type, the respective Workbench component default (including binaries, paths, config, ports etc) options will be used.
    • Or, if required, you can change these default options (paths, config, ports etc) by selecting a Custom install.
      • NOTE: The Workbench Primary Node installation must/will include ALL of the Workbench components above. Therefore if/when Primary Node is selected, ALL mandatory Workbench Primary components above will be installed on the host.
  13. ​​​Once you’ve selected the appropriate options, click Next.
    • NOTE: For High Availability (HA), you can install additional Workbench application nodes/components.
  14. Provide the Workbench Data-Center name (i.e. "EMEA" or "LATAM" or "Chicago" - do NOT use "default")
    • NOTE: Workbench Data-Centers is a logical concept to categorize and optimize the respective Workbench Hosts, Applications and ingested data for event distribution, visualization context and filtering purposes. Each Workbench host, and the respective applications within that host, are assigned to a Data-Center, this is mandatory. 
    • NOTE: The Data-Center name is case-sensitive, limited to a maximum of 10, Alphanumeric and underscore characters only.​​​
  15. Once the Data-Center name has been entered, click Next.
  16. The next Base Workbench Properties screen provides basic information that is relevant to all Workbench components
    • This is required irrespective of whether the installation is Primary or Additional and if Default or Custom was chosen.
    • Provide the Workbench Home Location folder where Workbench components will be installed (i.e. "C:\Program Files\Workbench_9.x.xxx.xx").
    • Review the network Hostname - this should be accessible/resolvable within the domain
    • Based on the Planning/Sizing section, enter the Total number of Workbench Elasticsearch Nodes to be used by the Workbench solution.
      • The default 3 Elasticsearch Node value is correct even if a 1 x Workbench stand-alone architecture is being deployed; this enables future expansion if/when needed.
  17. Once all required information is added, click Next.
    • NOTE: The Elasticsearch component is bundled with Workbench and is used to store all of the ingested data related to Workbench. An instance of Elasticsearch is installed through the Workbench Primary Node installation; For other, HA node instances, you can use the Workbench installer and proceed through the Workbench Additional Node(s) installation.
  18. The next Primary Components To Be Installed screen lists the Workbench components that will be installed for the Primary Node
    • ALL the Workbench components to be installed are selected by default, since these are mandatory
  19. Click Next to continue.
    • NOTE: The Workbench Agent is installed regardless of whether this is a Primary or Additional Node(s) installation.
    • NOTE: The Workbench Server and Client applications must have been previously created/existing in the Genesys Engage Configuration Server; please review the Planning and Deployment\Planning section of this document for more details. From a Workbench perspective these Applications are case-sensitive therefore please verify case/spelling.
  20. The next PureEngage (PE) Configuration Server (CS) Settings screen relates to the Workbench to Genesys Engage integration:
    • Provide the Genesys Engage Configuration Server Hostname/IP address
    • Provide the Genesys Engage Configuration Server Port (i.e. 2020)
    • Provide the Genesys Engage Workbench Server Application Name (i.e. "WB9IO")
    • Provide the Genesys Engage Workbench Client Application Name (i.e. "WB9Client")
  21. Once complete, verify the settings, click Next.
  22. The next Genesys Engage Solution Control Server and Message Server Settings screen enables selection of the Genesys Engage Solution Control Server (SCS) and Message Server (MS) applications to which Workbench will connect.
  23. Select the relevant Genesys Engage SCS and MS applications, based on the associated Configuration Server from the previous screen, for Workbench to connect to and click Next.
  24. The next Service Account Settings screen enables the selection of either System or Network Account.
    • The Workbench components are installed and executed as Services. Select either Local System Account or a Network Account; if Network Account is selected, provide the Username and Password to be used.
  25. Once complete, click Next.
  26. With all the workbench options now configured, press Install to start the Workbench installation process.
    • NOTE: The Show Details button allows you to review the steps the installer is taking to install the Workbench component(s). This is also a good source for any errors that may be observed.
  27. ​​​​When the Workbench installation completes the dialog below will be presented. Click OK or Exit.

Initial login

  1. Navigate to your host's URL. It will look something like:
    • http://<WORKBENCH_HOST>:8181
  2. Enter your login credentials.
  3. You will be presented with the Home Dashboard:

Windows services that run on the primary node/host

Wb 9.1.100.00 windows services.png

Linux

The Workbench installation files will be contained in the Genesys My Portal obtained downloaded compressed file.

See also Download Workbench.

NOTE:

  • Workbench requires the installation of a Primary Node at each and every Data-Center.
  • The Workbench Primary Node must be installed prior to installing Workbench Additional Nodes.
  • Workbench ships with its own pre-bundled Java distribution, OpenJDK11; all Workbench components will be configured through the installation to use this Java distribution and should not affect any other components that may be installed on the host.
  • The Workbench installation uses the Ant Installer component, if during the Workbench installation a Network Account install is selected, the Ant Installer prints the username and password details to the "ant.install.log" file. Genesys therefore recommends, post installation, at a minimum the "ant.install.log" file be manually edited and the password be masked/deleted.
  • Use a non root account with sudo permissions when running the Workbench install.sh file.
  • If the Workbench installation is cancelled mid completion, please ensure the Workbench install directory is cleaned/purged prior to attempting another install

WARNING:

  • When installing Workbench on Linux ensure you use a non root account with sudo permissions for all the commands below - DO NOT USE THE <ROOT> ACCOUNT.
  • Workbench uses the Hostname for component configuration
  • Please ensure hostname resolution between Workbench and Engage Hosts is accurate and robust
  • If the Workbench Hosts have multiple NIC's, please ensure the Hostname resolves to the desired IP Address prior to Workbench installation

Install Workbench 9.x

  1. To extract Workbench_9.x.xxx.xx_LINUX_Pkg.tar.gz compressed file, run:
    • tar zxf Workbench_9.x.xxx.xx_LINUX.tar.gz
  2. Go to the folder:
  3. ip\linux
  4. Run:
  5. To extract the Workbench_9.x.xxx.xx_linux.tar.gz compressed tar file, run:
    • tar zxf Workbench_9.x.xxx.xx_Installer_Linux.tar.gz
  6. Run:
    • ./install.sh
    • WARNING: do not prefix with sudo.
  7. At the Welcome to Genesys Care Workbench 9.x installer prompt, press Enter.
  8. At the Press enter to view the license agreement prompt, press Enter.
  9. At the Accept Terms and Conditions prompt, press Y or Enter to accept.
  10. At the Workbench Installation Mode prompt, there are two options:
    • New Installation - no Workbench 9.x components are yet running on this host/node
    • Upgrade - you already have Workbench 9.x components running on this host/node and wish to upgrade
  11. Press Enter or 1 for New Installation.
  12. At the Workbench Installation Type prompt, there are two options:
    • Primary Node - there are currently no Workbench components running on this host/node
    • Additional Node - you're installing additional Workbench components on this host/node to form a Workbench Cluster
  13. Press Enter or 1 for Primary Node.
  14. At the PLEASE SELECT EITHER A 'DEFAULT' OR 'CUSTOM' INSTALLATION TYPE prompt, there are two options:
    • Default - the respective Workbench components Default settings will be used.
      • Default settings being binaries, paths, config, ports etc
    • Custom - or, if required, you can change the default settings by selecting a Custom install.
  15. Select whichever option best applies to your scenario.
  16. Enter a DATA-CENTER name.
    • Workbench Data-Centers are a logical concept to categorize and optimize the respective Workbench Hosts, Applications and ingested data for event distribution, visualization context and filtering purposes
    • NOTE: The Data-Center name is case-sensitive, limited to a maximum of 10, Alphanumeric and underscore characters only.
  17. Enter the Workbench component installation path (press Enter to accept the default of /opt/Genesys/Workbench_9.1.000.00).
    • The destination installation path to which the Workbench components will be copied
  18. The Hostname of the machine is displayed for reference.
  19. Enter the Total Number of Workbench Elasticsearch Nodes for this Data-Center (press Enter to accept the default of 3, which is correct even if you are deploying a single node)
  20. The Primary Components To Be Installed screen will display, denoting which components are being installed to the host/node.
  21. The PureEngage (PE) Configuration Server (CS) Settings screen will display, denoting the Engage settings to which this Workbench node will integrate too
  22. Enter the:
    • Genesys Engage Configuration Server Hostname/IP address
    • Genesys Engage Configuration Server Port (i.e. 2020)
    • Genesys Engage Workbench Server Application Name (i.e. "WB9IO")
    • Genesys Engage Workbench Client Application Name (i.e. "WB9Client")
  23. At the PureEngage Solution Control Server and Message Server Settings screen, enter the corresponding number relevant to Genesys Engage SCS and MS applications for Workbench to connect to based on the associated Configuration Server previously supplied.
  24. The installation progress screen will display, after which the installation will complete.

Initial login

  1. Go to:
    • http://<WORKBENCH_HOST>:8181
  2. Enter your login credentials.
  3. You will be presented with the Home Dashboard screen.

Services that run on the Linux host/node

The Workbench Primary node/host will contain the following Linux Services:

  • WB_Agent_9.x.xxx.xx
  • WB_Elasticsearch_9.x.xxx.xx
  • WB_Heartbeat_9.x.xxx.xx
  • WB_Kibana_9.x.xxx.xx
  • WB_Logstash_9.x.xxx.xx
  • WB_Metricbeat_9.x.xxx.xx
  • WB_ZooKeeper_9.x.xxx.xx


As an example, executing sudo service --status-all | grep WB would yield:

Status of WB_Agent_9.x.xxx.xx ...
WB_Agent_9.x.xxx.xx is running
Status of WB_Elasticsearch_9.x.xxx.xx ...
WB_Elasticsearch_9.x.xxx.xx is running
Status of WB_Heartbeat_9.x.xxx.xx ...
WB_Heartbeat_9.x.xxx.xx is running
WB_IO_9.x.xxx.xx is running (3195).
Status of WB_Kibana_9.x.xxx.xx ...
WB_Kibana_9.x.xxx.xx is running
Status of WB_Logstash_9.x.xxx.xx ...
WB_Logstash_9.x.xxx.xx is running
Status of WB_Metricbeat_9.x.xxx.xx ...
WB_Metricbeat_9.x.xxx.xx is running
Status of WB_ZooKeeper_9.x.xxx.xx ...
WB_ZooKeeper_9.x.xxx.xx is running

Workbench Visualizations is an analysis and visualization component that enables the user to create real-time and historic visualizations of ingested data; which are then used to build Dashboards to present the data.

Access Visualizations

  1. Click Visualize on the Workbench top navigation bar.

Visualizations functionality

With Visualizations you can:

  • Create new Visualizations from the shipped Genesys General and Genesys Health-Maps Visualization Types
  • Create new Visualizations from the standard Kibana Visualization Types
  • Search for Visualizations
  • Save Visualizations
  • Share Dashboards
  • Clone/Copy Visualizations
  • Edit/Customize Visualizations
  • Arrange Visualizations within the Dashboards.
  • Gain monitoring and troubleshooting insights from the shipped Visualizations and newly created Visualizations.
  • Use and learn from shipped example Visualizations.
  • View the shipped Visualizations within the shipped Dashboards.

Visualizations types

These Visualizations are included in the shipped Workbench Dashboards for context.

General

  • Alarms
    • All Source Active Alarms
    • Workbench Active Alarms
    • Genesys Engage Active Alarms
  • Changes
    • All Source Changes
    • Workbench Changes
    • Genesys Engage Changes
  • Channel Monitoring
    • Active Alarms
    • Call Flow Configuration
    • Today's Call Flow Tests Summary
  • Remote Alarm Monitoring
    • Alarms Sent to RAM Service
  • System Status & Health
    • Workbench Status Summary
    • Workbench Agents
    • Channel Monitoring
    • Remote Alarm Monitoring
    • Genesys Engage Integration
    • Data-Centers
    • Auditing
    • General
  • Workbench Summary
    • Workbench Applications
    • Workbench Hosts
  • Genesys Engage Summary
    • Genesys Engage Applications
    • Genesys Engage Hosts
    • Genesys Engage Solutions
    • Genesys Engage HA Pairs

Health-Map

  • Applications (Workbench and Genesys Engage)
  • Hosts (Workbench and Genesys Engage)
  • Genesys Engage Solutions

Create a new Health-Map

NOTE: In Workbench 9.0 Health-Maps can only be created for Genesys Engage Hosts, Applications and Solutions; Workbench Health-Maps cannot be created.

  1. Navigate to Visualize from the top Workbench navigation bar.
  2. Click the + button.
  3. Select Genesys Health-Maps.
  4. Ensure Genesys Engage Applications is selected for the Health-Map Type.
  5. Check the relevant Genesys Engage Chat Applications you want displayed in the Health-Map.
  6. Click the Apply Changes button.
  7. Click Save.
  8. Provide a Visualization name (e.g., lab_apps_HM).
  9. Click Confirm Save.
  10. Click Dashboards.
  11. Click Create new dashboard.
  12. Click Add to add a Visualization to this Dashboard.
  13. Find and click the HM_Chat_Applications.
  14. Click the X to close the Add Panels dialog.
  15. The HM_Chat_Applications Visualization has now been added to the Dashboard.
  16. Click Save.
  17. Provide a lab_apps_db and click Confirm Save.

Kibana Visualizations types

In addition to the shipped Genesys Visualization Types, the user can also leverage the standard Kibana Visualization types such as Area, Horizontal Bar, Line, Metric, Pie, etc.

NOTE: Workbench Dashboards and Visualizations leverage the Elastic Kibana component, please review the Kibana documentation for detailed guidance.

WARNING

  • It's imperative you review, plan and define the details below before installing Workbench; failure to do so could result in a Workbench re-installation
  • Review and complete each sub-section below before moving onto the next
  • Workbench can be deployed as a single-node/host or as a multi-node/host cluster.
  • The Workbench multi-node cluster deployment is available to support high-availability and/or environments that have a high volume of events/metrics.
  • Multiple Data-Centers are supported, where Workbench can be deployed as single-node/host or as a cluster per Data-Center.
  • Workbench deployments across Data-Centers can then be connected and synced in real-time to provide holistic visibility of the Alarms, Changes, Channel Monitoring and Auditing features.
  • To determine the number of Workbench nodes/hosts, and the resource requirements for each, please follow the steps below.

WARNING: The Workbench 9.x Sizing steps below should be followed for each Data-Center where Workbench will be deployed.

Calculate Workbench node/host disk space

Based on the number of Hosts (i.e. Engage SIP, URS, FWK etc) that Workbench will ingest Metric data from, review the table below to determine the respective disk space required for each Workbench Host at a given Data-Center:

Number of Hosts
  • to ingest Metric data from
Total Disk Space
  • assuming a 30 day Workbench data Retention Period and a 60 second Metric collection frequency
1-50 250 GB
51-100 500 GB
101-150 750 GB
150+ 1 TB [+250 GB for every 50 hosts > 200]

Note the Total Disk Space = ___________ (used for next steps)

WARNING

  • Currently Workbench 9.x is limited to a maximum of 100 Hosts (the global combined Workbench or Engage Hosts), the table above details beyond the 100 Host limit for future Workbench sizing context.

Only if/when the default Retention Period and Metric Frequency settings are changed

The table above assumes the Workbench default data Retention Period of 30 days and a Workbench Agent/Remote Metric collection frequency of every 60 seconds.

If these default Retention Period and Metric Frequency values require modification, please re-calculate the Total Disk Space, by using the scale factors below:

  • Retention Scale Factor = [New Retention Period Days] / 30
  • Metric Frequency Scale Factor = 60 / [New Collection Frequency Seconds]
  • Re-calculated Total Disk Space = Disk Space (from the section 1 table above) * Retention Scale Factor * Metric Frequency Scale Factor

NOTE:

  • The global Workbench Retention Period is editable via Workbench Configuration\General\Retention Period\Workbench Data Retention Period (Days)
  • The Metric Frequency collection setting can be changed on each Workbench Agent and Workbench Agent Remote application via:
    • Workbench Configuration\Applications\Application Name (i.e. WB_Agent_Primary)\MetricBeat Host Metrics\Host Metric Collection Frequency (seconds)
    • Workbench Configuration\Applications\Application Name (i.e. WB_Agent_Primary)\MetricBeat Associated Application Metrics\Application/Process Metric Collection Frequency (seconds)

Determine the node/host count

Using the Total Disk Space calculation from the previous step, next determine the required number of Workbench Nodes/Hosts:

Total Disk Space from Step 1 or 2 above Number of Workbench Nodes/Hosts Required
is less than 2.5 TB A single (1) Node/Host Workbench can be used
is greater than 2.5 TB OR if Workbench High Availability is required A 3 x Nodes/Hosts Workbench Cluster is required

NOTE:

  • Workbench High-Availability (HA) is resiliency of event data (via Workbench Elasticsearch) and configuration data (via Workbench ZooKeeper)

Node/host resources

This section details the per Workbench Node/Host recommended resources based on the previous steps:

Type Specification
Workbench Primary Node/Host
  • be it single Node or part of a 3 Node Cluster
  • CPU: 10 Cores/Threads
  • Memory: 24 GB
  • NIC: 100 MB
  • Disk:
    • if a single Workbench Node/Host = Total Disk Space from Step 1 or 2 above
    • if part of a Workbench 3 Node Cluster = divide the Total Disk Space from Step 1 or 2 above by 3
      • The Total Disk Space is divided by 3 due to the Workbench Cluster deployment architecture
Non Workbench Primary Nodes/Hosts
  • that are part of a Workbench Cluster
  • CPU: 10 Cores/Threads
  • Memory: 16 GB
  • NIC: 100 MB
  • Disk: Total Disk Space from Step 1 or 2 above / 3
      • The Total Disk Space is divided by 3 due to the Cluster deployment architecture

NOTE:

  • The following Memory allocation is need for each Workbench Elasticsearch Node/Host in the deployment.
  • Please review ES Heap Settings for details on configuring the RAM for each Workbench Elasticsearch instance.
Total Disk Space per Node/Host Dedicated Workbench Elasticsearch Memory Required
< 100 GB 2 GB RAM
100 - 750 GB 4 GB RAM
750 - 1.5 TB 6 GB RAM
1.5 - 2.5 TB 8 GB RAM

NOTE:

  • If/when Total Disk Space is greater than 2.5 TB per Node/Host, please raise a Genesys Customer Care Case for consultation/guidance.

Required number of additional node(s)/host(s) at each Data-Center

Workbench currently supports ingesting Metric data from a maximum of 100 Hosts.

Required Number of WB additional Nodes/Hosts Number of Hosts sending Metric data to Workbench Frequency of Metrics being sent from each Host to Workbench
0 (WB on Primary host) 100 60 (default)
1 (WB on Primary host and Logstash on the additional node) 100 30
1 (WB on Primary host and Logstash on the additional node) 100 10

Example 1: Ingest from 10 hosts - 30 day retention period - 60 second metric frequency

A production Workbench deployment ingesting Metric data from 10 Engage Hosts:

  • Number of Hosts to ingest Metric data from = 10
  • Retention Period = 30 days (default)
  • Metric Frequency Collection = 60 seconds (default)
  • Total Disk Space = 250 GB
  • 1 x Workbench Node/Host
    • CPU: 10 Cores
    • RAM: 24 GB
    • NIC: 100 MB
    • DISK: 250 GB
    • DEDICATED Elasticsearch RAM: 4 GB

Example 2: Ingest from 30 hosts - 7 day retention period - 10 second metric frequency

A production Workbench deployment ingesting Metric data from 30 Engage Hosts:

  • Number of Hosts to ingest Metric data from = 30
  • Retention Period = 7 days
    • therefore re-calculated Retention Scale Factor is 7 (days) / 30 => 0.23
  • Metric Frequency Collection = 10 seconds
    • therefore re-calculated Metric Frequency Scale Factor is 60 / 10 => 6
  • Re-calculated Total Disk Space is 250 GB * 0.23 * 6 => 345 GB
  • 1 x Workbench Node/Host
    • CPU: 10 Cores
    • RAM: 24 GB
    • NIC: 100 MB
    • DISK: 345 GB
    • DEDICATED Elasticsearch RAM: 4 GB

Example 3: Ingest from 90 hosts - 90 day retention period - 30 second metric frequency

A production Workbench HA deployment ingesting Metric data from 90 Engage Hosts:

  • Number of Hosts to ingest Metric data from = 90
  • Retention Period = 90 days
    • therefore re-calculated Retention Scale Factor is 90 (days) / 30 => 3
  • Metric Frequency Collection = 30 seconds
    • therefore re-calculated Metric Frequency Scale Factor is 60 / 30 => 2
  • Re-calculated Total Disk Space is 500 GB * 3 * 2 => 3000 GB (3 TB)
  • 3 x Workbench Nodes/Hosts required given Total Disk Space is greater than 2.5 TB
  • Workbench Primary
    • CPU: 10 Cores
    • RAM: 24 GB
    • NIC: 100 MB
    • DISK: 1000 GB (1 TB on each Node/Host given the Cluster architecture)
    • DEDICATED Elasticsearch RAM: 8 GB
  • Workbench Nodes 2 and 3
    • CPU: 10 Cores
    • RAM: 16 GB
    • NIC: 100 MB
    • DISK: 1000 GB (1 TB on each Node/Host given the Cluster architecture)
    • DEDICATED Elasticsearch RAM: 8 GB

Workbench Host/Server Operating System requirements

Platform Version
Microsoft Windows Server 2012
Microsoft Windows Server 2016
Red Hat Enterprise Linux (RHEL) 7
CentOS 7

Workbench 9.x comprises several components; a network Admin-level account is required that has Full Control permissions for all Workbench application related folders.

WARNING

  • The Workbench Primary and Additional (e.g., Node2 and Node3) hosts/nodes (across ALL Data-Centers) should all be running the same Operating System.
  • Workbench uses the Hostname for component configuration
  • Please ensure DNS hostname resolution between the Workbench Hosts and the Engage Hosts is accurate and robust
  • If the Workbench Hosts have multiple NIC's, please ensure the Hostname resolves to the desired IP Address prior to Workbench installation
  • Workbench 9.x is limited to a maximum of 100 Hosts (the global combined Workbench or Engage Hosts), due to delays in loading the Configuration Host and Application objects/details; this limitation will be addressed in the next release of Workbench.

Supported browsers

  • Google Chrome

Workbench 9 to Engage integration

Genesys recommends Engage Configuration Server, Solution Control Server, Message Server and SIP Server versions of 8.5+.

WARNING

  • If your Engage Configuration Servers are configured for HA, please ensure the respective CME Host Objects have the IP Address field configured, else Workbench will fail to install.
  • Ensure each and every Engage CME Application has an assigned Template else the Workbench installation will fail.
  • Genesys support for the platform versions mentioned on this page ends when the respective vendors declare End of Support.

WARNING

  • Currently Workbench Agent 9.x uses Port 5067 - this unfortunately clashes with GVP - if your Genesys deployment contains GVP please change the Workbench Agent(s) Port (e.g., to 5068) and restart the Workbench Agent(s) and Workbench Logstash(s) components.
    • This oversight will be addressed in a future Workbench 9.x release

Java requirements

Workbench 9.x ships/installs with a pre-bundled OpenJDK 11 package, therefore the historical JRE is not mandatory.

NOTE:

  • the Workbench Agent that gets installed on the Workbench Nodes/Hosts utilizes the pre-bundled OpenJDK 11 package
  • the Workbench Agent (Remote, WAR) that's installed on “remote” Nodes/Hosts (i.e. SIP, URS, FWK etc) is Go based and therefore does not rely on either OpenJDK or the historical JRE packages

WARNING

  • If the JAVA_OPTS settings are changed, ensure the xms and xmx values are different; if the values are the same issues will be encountered when starting Logstash

Network ports - Workbench hosts

Workbench components use the network ports below, from a firewall perspective, please review, edit and ensure not already in use.

WARNING

  • Double-check, these network ports below, that are used by Workbench, are from a firewall perspective, open and not already in use by other applications

Workbench Host Ports (i.e. the Primary, Node 2, Node 3, Node N etc hosts)

Port Component Comments
81822552 Workbench IO
  • Mandatory to open in firewall for Workbench Users connecting to the Workbench UI
  • Ports 8182 & 2552 can be changed (select custom install to change from these defaults) at install time
  • Ports 8182 & 2552 ports cannot be changed via the WB UI post install
8181 Kibana
  • Mandatory to open in firewall for Workbench Users connecting to the Workbench UI
  • Port 8181 can be changed (select custom install to change from these defaults) at install time
  • Port 8181 can be changed via the WB UI post install
90915067 Workbench Agent & Metricbeat
  • Only publicly open in the firewall on the Workbench host if/when using a Workbench Cluster
  • Ports 9091 & 5067 can be changed (select custom install to change from these defaults) at install time
  • Ports 9091 & 5067 can be changed via the WB UI post install
9200, 9300 Elasticsearch
  • Only publicly open in the firewall on the Workbench host if/when using a Workbench Elasticsearch Cluster
  • Port 9200 can be changed via the WB UI post install
  • Port 9300 cannot be changed via the UI post install
9600 Logstash
  • Only publicly open in the firewall on the Workbench host if/when using:
    • Workbench Cluster
    • Workbench Agent Remote components installed on Engage hosts
  • Port 9600 can be changed via the WB UI post install
5047 Logstash Status Pipeline (all ports can be changed via the WB UI)
  • Only publicly open in the firewall on the Workbench host if/when using:
    • Workbench Cluster
    • Workbench Agent Remote components installed on Engage hosts
  • Port 5047 can be changed (select custom install to change from these defaults) at install time
  • Port 5047 can be changed via the WB UI post install
5048 Logstash Metrics Pipeline (all ports can be changed via the WB UI)
  • Only publicly open in the firewall on the Workbench host if/when using:
    • Workbench Cluster
    • Workbench Agent Remote components installed on Engage hosts
  • Port 5048 can be changed (select custom install to change from these defaults) at install time
  • Port 5048 can be changed via the WB UI post install
5077 Heartbeat HTTP Port (all ports can be changed via the WB UI)
  • Only publicly open in the firewall on the Workbench host if/when using:
    • Workbench Cluster (all ports can be changed via the WB UI)
    • Workbench Agent Remote components installed on the Engage hosts
  • Port 5077 can be changed (select custom install to change from these defaults) at install time
  • Port 5077 can be changed via the WB UI post install
2181, 2888, 3888 ZooKeeper
  • Only publicly open in the firewall on the Workbench host if/when using Workbench ZooKeeper Cluster
  • Ports 2181, 2888 and 3888 can be changed via the WB UI post install

Network ports - Non-Workbench hosts (e.g., SIP, URS, FWK, etc.)

NOTE: The ports below can be edited via the Workbench Configuration Console through the respective Workbench application object

WARNING: Ensure the Ports are reviewed, edited, opened and not in use prior to starting the Workbench installation

Port(s) Component
90915067 Workbench Agent & Metricbeat on the remote Engage (i.e. SIP, URS, FWK etc Hosts)
   
  • Workbench Agent/Metricbeat installed on the Genesys Application Servers will send metric data to the local WB Data-Center instance/Cluster

Hardware sizing requirements

Please review What hardware size should I use for Workbench.

Linux pre-installation steps

For Linux based installations, some Operational System settings are required to enable support of Elastic Search, a key components of Workbench 9.

  1. Run the command:
    • ulimit -a
  2. This should print something like the following:
         bash-4.2$ ulimit -a
         core file size (blocks, -c) 0
         data seg size (kbytes, -d) unlimited
         scheduling priority (-e) 0
         file size (blocks, -f) unlimited
         pending signals (-i) 31152
         max locked memory (kbytes, -l) 64
         max memory size (kbytes, -m) unlimited
         open files (-n) 8192
         pipe size (512 bytes, -p) 8
         POSIX message queues (bytes, -q) 819200
         real-time priority (-r) 0
         stack size (kbytes, -s) 8192
         cpu time (seconds, -t) unlimited
         max user processes (-u) 4096
         virtual memory (kbytes, -v) unlimited
         file locks (-x) unlimited
  3. Make the following changes:
    1. Run the command
      • sudo vi /etc/security/limits.con
    2. Add the following lines to the bottom. <username> is the current username.
      • <username> - nofile 131070
      • <username> - nproc 8192
      • <username> - memlock unlimited
    3. Logout and log back in.
    4. Run the command:
      • sudo sysctl -w vm.max_map_count=262144
    5. Run the command:
      • sudo vi /etc/sysctl.conf
    6. Add the line vm.max_map_count=262144 to the bottom.
  4. Exit the current terminal window and open a new one.
  5. Run the command:
    • ulimit -a
  6. This should print something like the following:
         bash-4.2$ ulimit -a
         core file size (blocks, -c) 0
         data seg size (kbytes, -d) unlimited
         scheduling priority (-e) 0
         file size (blocks, -f) unlimited
         pending signals (-i) 31152
         max locked memory (kbytes, -l) 64
         max memory size (kbytes, -m) unlimited
         open files (-n) 131070
         pipe size (512 bytes, -p) 8
         POSIX message queues (bytes, -q) 819200
         real-time priority (-r) 0
         stack size (kbytes, -s) 8192
         cpu time (seconds, -t) unlimited
         max user processes (-u) 8192
         virtual memory (kbytes, -v) unlimited
         file locks (-x) unlimited
  7. Verify the following values match:
    • max user processes=8192
    • open files=131070

RHEL 7.x - specific steps

The following change is needed only for machines running Red Hat Enterprise Linux Server release 7.x.

For the Workbench services to start correctly after a machine reboot, it is necessary to run the following commands:

  1. Type:
    • sudo visudo
  2. Press Enter.
  3. Enter the sudo password when prompted.
  4. Change the line Defaults requiretty in the opened file to:
    • #Defaults requiretty
  5. Type:
    • :wq
  6. Press Enter to save the changes and exit.

Alternatively, upon reboot of the machine, these services can be manually started in the following sequence:

  • service WB_Elasticsearch_9.1.000.00 start
  • service WB_ZooKeeper_9.1.000.00 start
  • service WB_Kibana_9.1.000.00 start
  • service WB_Agent_9.1.000.00 start
  • service WB_IO_9.1.000.00 start

The Workbench Configuration Changes Console is a dedicated console that displays a real-time statistics summary as well as a data-table of historic Workbench and Engage Configuration Changes.

NOTE: Currently Workbench is limited to tracking/displaying Engage CME Host, Application, and Solution objects only; all other CME objects are not monitored by Workbench.

The statistics summary being Configuration Changes that occurred Today, Yesterday, This Week, Last Week, This Month, Last Month for:

  • All Source Changes; Changes from Workbench and Engage
  • Workbench Changes; Changes only from Workbench
  • Genesys Engage Changes; Changes only from Engage

The Changes Console also provides a real time data-table of historic Changes, from either Workbench and Engage (All Source Changes), Workbench only Changes or Engage only Changes; the Changes data-table provides the following functionality:

  • Columns
    • Generated - the generation DateTime of this Change event
      • Note: Timestamps are stored in UTC and translated to local time based on the Users Browser Time-Zone
    • Config Object - the particular Object of this Change event
    • Changed Item - the Item of this Change event
    • New Value - the new value of this Change event
    • ChangedBy - the User who actioned the change
    • Data-Center - the associated Data-Center
    • ID - the internal ID of this Change event
    • DB ID - the internal DB ID of this Change event
  • Export
    • PDF or XLS
  • Column Visibility
    • Show/Hide columns
  • Normal/Full-Screen
  • Column Reordering
    • move columns left or right within the data-table
  • Column Search/Filter
    • Filter data-table events based on DateTime, drop-down or text searches
  • Column Sort
    • Generated and Sent to RAM Service

Changes Console ChangedBy field for Engage Changes

For the Changes Console ChangedBy field to be accurate (not N/A), the following Engage configuration is required:

  • A connection from the respective Engage Configuration Server or Configuration Server Proxy to the Engage Message Server that Workbench is connected to.
  • If not already, standard=network added to the log section of the Configuration Server or Configuration Server Proxy that Workbench is connected to.

Changes Console and Workbench Data-Center Synching

WARNING: Post a Workbench Data-Center sync, existing Workbench Changes will be synced based on the Workbench Retention Period; Engage Changes will not be synched because each Workbench Data-Center IO component has it's own integration to the Engage Configuration/Message Server components and therefore synching is not required.

Genesys Workbench (WB) 9 is a monitoring, testing, troubleshooting and remediation solution, with a suite of tools to assist with the operational monitoring, management and troubleshooting of Genesys platforms.

Please review the User Guide before installing WB.

NOTE: Prior to downloading Workbench, you must accept the Terms and Conditions.

Key features in version 9.2

  • A new Workbench UI enabling richer Dashboard and Visualization capabilities providing an at-a-glance view of Genesys platform health and status.
  • View Genesys Engage Alarms via the Workbench Alarms Console, complimenting existing products such as Genesys Administrator Extensions (GAX).
  • View Genesys Engage Changes via the Workbench Changes Console, enabling greater context and perspective of Genesys Engage Application Object changes.
  • Leverage Workbench Channel Monitoring to create and schedule voice test calls to proactively identify potential interaction and routing issues before your customers are impacted; this feature can test Genesys voice call flows ensuring your service is functioning as designed and alerting you when issues are encountered.
    • Workbench Channel Monitoring integrates directly to the Genesys SIP Server and not the SIP Server Proxy
  • Take advantage of the Workbench Remote Alarm Monitoring Service, when activated, the customers on-premise Workbench instance sends specific Alarms to Genesys Customer Care, this alarm interaction is intelligently routed to a Genesys analyst who will then proactively create a Support Case and will liaise with the customer accordingly to resolve the issue(s); the alarms can also be sent to the Genesys Mobile App if subscribed.
  • View Audits via the Workbench Configuration/Auditing Console, enabling similar context to Changes with added detail such as Workbench Login/Logout events.
  • Ingest Metric data events, via the Workbench Agent(s), for analysis, troubleshooting and operational insights
  • Explore and observe metric data event insights via Workbench Dashboards and Visualizations
  • Create your own custom metric data event Dashboards and Visualizations
  • Analyze the raw ingested metric data events via the Workbench Discover Console
  • Search/filter for particular metrics, components, values etc
  • Anomaly Detection Workbench Insights feature that will be autonomously and predictively raise anomalies based on the ingested Metric data

Current version of Workbench

Prior versions of Workbench

In specific scenarios where an older release is needed, open a request case with Product Support.

Workbench Anomaly Detection (AD) add-on

Workbench documentation

The Discover Console allows the user to explore and visualize the raw data events ingested into Workbench.

Use the Discover Console to:

  • View and analyze raw ingested document data for a given time range
  • Submit searches via the Search bar
  • Add Filters based on the fields in the document
  • View the count of ingested documents over time via the top histogram 

Access the Discover Console

  1. From the navigation bar, click Discover.
  2. Apply filters as desired.

Workbench Deployment Architecture

Workbench integrates to the Genesys Engage platform, as such the following Genesys Engage Objects will be required and leveraged by Workbench:

 
Component Description/Comments
Genesys Engage Workbench Client application/object Enables Engage CME configured Users to log into Workbench
Genesys Engage Workbench IO (Server) application/object Enables integration from Workbench to the Engage CS, SCS and MS
Genesys Engage Configuration Server application/object Enables integration from Workbench to the Engage CS; authentication and Config Changes
Genesys Engage Solution Control Server application/object Enables integration from Workbench to the Engage SCS; Alarms to WB from SCS
Genesys Engage Message Server application/object Enables integration from Workbench to the Engage MS; Config change ChangedBy metadata
Genesys Engage SIP Server application/object (optional) Enables integration from Workbench to the Engage SIP Server enabling the Channel Monitoring feature

Stand-alone/single node architecture with a single Engage Data-Center

Provides the following:

  • A Genesys Engage single Data-Center/Site (e.g., APAC) deployment
  • Workbench integrates into the Engage Master Configuration Server (CS)
  • Workbench integrates into the Engage Solution Control Server (SCS) and associated Message Server (MS)
  • The Workbench Channel Monitoring feature functions via the WB IO application integrating to the respective Engage SIP Server
  • Workbench Users connect to the Workbench Primary (WB IO application) instance and can visualize the features of WB
  • If the Workbench Agent component is installed on any Genesys Application servers (e.g., SIP, URS, FWK, etc.)
    • Metric data from those hosts will be sent to the Workbench node for storage, providing visualizations via the Workbench Dashboard feature

Cluster HA architecture with a single Engage Data-Center

NOTE: Workbench High-Availability (HA) is resiliency of event data (via Workbench Elasticsearch) and configuration data (via Workbench ZooKeeper)

Provides the following:

  • A Genesys Engage single Data-Center/Site (e.g., APAC) deployment
  • Workbench Primary node integrates into the Engage Master Configuration Server (CS)
  • Workbench Primary node integrates into the Engage Solution Control Server (SCS) and associated Message Server (MS)
  • The Workbench Channel Monitoring feature functions via the WB IO application integrating to the respective Engage SIP Server
  • Workbench Users connect into the Workbench Primary (WB IO application) instance and can visualize the features of WB
  • For HA resiliency, Workbench Node 2 contains event data (via Workbench Elasticsearch) and configuration data (via Workbench ZooKeeper)
  • For HA resiliency, Workbench Node 3 contains event data (via Workbench Elasticsearch) and configuration data (via Workbench ZooKeeper)

Cluster HA architecture with multiple Engage Data-Center (no/limited Metric ingest)

WARNING: This architecture has no\limited Engage Metric data ingestion by design.

NOTE

  • This architecture is best suited for customers who do not wish to ingest Metric data from their Genesys Application Servers (e.g., SIP, URS, FWK, etc.) but wish to leverage the other features of Workbench via a minimal HA footprint
  • The footprint could be reduced further by only deploying a Workbench Primary node at the APAC Data-Center, thereby providing no HA, but offers a minimal Workbench footprint investment.

Provides the following:

  • A Genesys Engage multi Data-Center/Site (e.g., APAC and EMEA) deployment
  • A Workbench Primary, Node 2 and Node 3 Cluster - only installed at the APAC Data-Center
  • The Workbench Primary at the APAC Data-Center integrates into the respective local Configuration Server
  • The Workbench Primary at the APAC Data-center integrates into the respective local Solution Control Server and associated Message Server
  • The Workbench Channel Monitoring feature functions via the WB IO application integrating to the respective Engage SIP Server
  • EMEA Alarms and Changes events would be ingested into the APAC Workbench Cluster via Engage CS Proxy and Distributed SCS components
  • Workbench Users at both APAC and EMEA would connect to the APAC Workbench Primary (WB IO application) instance and can visualize the features of WB
  • Workbench Agents would only be installed on the APAC Data-Center, on the Workbench Hosts by default
    • Installing the Workbench Agent Remote component on the Genesys Application Servers in the APAC Data-Center is optional
  • Workbench Agents would NOT be installed on the EMEA Data-Center - due to the network Metric event data that would transition over the WAN

Stand-alone/single node architecture with multiple Engage Data-Centers

Provides the following:

  • A Genesys Engage multi Data-Center/Site (e.g., APAC and EMEA) deployment
  • Each Workbench Primary at each Data-Center integrates into the respective local Configuration Server
  • Each Workbench Primary at each Data-center integrates into the respective local Solution Control Server and associated Message Server
  • The Workbench Channel Monitoring feature functions via the WB IO application integrating to the respective Engage SIP Server
  • Workbench Users would logically connect into their local Workbench Primary (WB IO application) instance and can visualize the features of WB
    • Workbench Users can connect into either their local or remote Data-Center Workbench instances; this provides redundancy
  • If the Workbench Agent component is installed on any Genesys Application servers (e.g., SIP, URS, FWK, etc.)
    • Metric data from those hosts will be sent to the local Workbench node/cluster for storage, providing visualizations via the Workbench Dashboard feature

Cluster architecture with multiple Engage Data-Centers

NOTE: Workbench High-Availability (HA) is resiliency of event data (via Workbench Elasticsearch) and configuration data (via Workbench ZooKeeper)

Provides the following:

  • A Genesys Engage multi Data-Center/Site (e.g., APAC and EMEA) deployment
  • Each Workbench Primary at each Data-Center integrates into the respective local Configuration Server
  • Each Workbench Primary at each Data-center integrates into the respective local Solution Control Server and associated Message Server
  • The Workbench Channel Monitoring feature functions via the WB IO application integrating to the respective Engage SIP Server
  • Workbench Users would logically connect into their local Workbench Primary (WB IO application) instance and can visualize the features of WB
    • Workbench Users can connect into either their local or remote Data-Center Workbench instances; this provides redundancy
  • If the Workbench Agent component is installed on any Genesys Application servers (e.g., SIP, URS, FWK, etc.)
    • the Metric data from those hosts will be sent to the local Workbench node/cluster for storage, providing visualizations via the Workbench Dashboard feature
  • For resiliency, Workbench Node 2 contains event data (via Workbench Elasticsearch) and configuration data (via Workbench ZooKeeper)
  • For resiliency, Workbench Node 3 contains event data (via Workbench Elasticsearch) and configuration data (via Workbench ZooKeeper)

Workbench Anomaly Detection (AD) with a Cluster HA architecture with a single Engage Data-Center

Provides the following:

  • A Genesys Engage single Data-Center/Site (e.g., APAC) deployment
  • Workbench Primary node integrates into the Engage Master Configuration Server (CS)
  • Workbench Primary node integrates into the Engage Solution Control Server (SCS) and associated Message Server (MS)
  • The Workbench Channel Monitoring feature functions via the WB IO application integrating to the respective Engage SIP Server
  • Workbench Users connect into the Workbench Primary (WB IO application) instance and can visualize the features of WB
  • For HA resiliency, Workbench Node 2 contains event data (via Workbench Elasticsearch) and configuration data (via Workbench ZooKeeper)
  • For HA resiliency, Workbench Node 3 contains event data (via Workbench Elasticsearch) and configuration data (via Workbench ZooKeeper)
  • Workbench Anomaly Detection (AD) Primary Node

Workbench Anomaly Detection (AD) HA with a Cluster HA architecture with multiple Engage Data-Centers

Provides the following:

  • A Genesys Engage multi Data-Center/Site (e.g., APAC and EMEA) deployment
  • Each Workbench Primary at each Data-Center integrates into the respective local Configuration Server
  • Each Workbench Primary at each Data-center integrates into the respective local Solution Control Server and associated Message Server
  • The Workbench Channel Monitoring feature functions via the WB IO application integrating to the respective Engage SIP Server
  • Workbench Users would logically connect into their local Workbench Primary (WB IO application) instance and can visualize the features of WB
    • Workbench Users can connect into either their local or remote Data-Center Workbench instances; this provides redundancy
  • If the Workbench Agent component is installed on any Genesys Application servers (e.g., SIP, URS, FWK, etc.)
    • the Metric data from those hosts will be sent to the local Workbench node/cluster for storage, providing visualizations via the Workbench Dashboard feature
  • For resiliency, Workbench Node 2 contains event data (via Workbench Elasticsearch) and configuration data (via Workbench ZooKeeper)
  • For resiliency, Workbench Node 3 contains event data (via Workbench Elasticsearch) and configuration data (via Workbench ZooKeeper)
  • Workbench Anomaly Detection (AD) Primary Node and Node 2 - therefore the AD feature is running in HA mode

Workbench Data-Centers

A Data-Center (DC) is a logical concept containing Workbench components that are typically deployed within the same physical location, typically within the same Data-Center or Site.

For example, a WB distributed solution, could consist of a 3x Data-Center deployment, Data-Centers APACEMEA and LATAM.

Each WB Data-Center will be running Workbench components, such as:

  • Workbench IO
  • Workbench Agent
  • Workbench Elasticsearch
  • Workbench Kibana
  • Workbench Logstash
  • Workbench ZooKeeper

When installing Workbench, the user has to provide a Data-Center name, post install, the respective Workbench components will be assigned to the Data-Center provided.

Workbench Data-Centers provide:

  • Logical separation of Workbench components based on physical location
  • Logical and optimized data ingestion architecture
    • E.g., APAC Metric data from the SIP, URS and GVP Servers will be ingested into the APAC Workbench instance/Cluster
  • An holistic view of multiple Workbench deployments at different Data-Centers, all synchronized to form a Workbench distributed architecture
    • E.g., A user can log into the APAC Workbench instance and visualize Alarms, Changes and Channel Monitoring events/data from not only the local APAC WB instance/Cluster, but also the other EMEA and LATAM Data-Centers Workbench instances

NOTE: A Workbench host object cannot be assigned to a different Data-Center. A Genesys Engage host (e.g., SIP, URS, FWK, etc.) object can be re-assigned to a different Data-Center

Important notes

Future Workbench 9.x Architectures/Footprints

  • Workbench 9.x future architectures/footprints may change when future roadmap features are released; Workbench 9.x roadmap features are subject to change, timescales TBD.

Workbench Agent and Workbench Agent Remote

  • Workbench Agent 8.5 is ONLY for LFMT
  • Workbench Agent 9.x is ONLY for Workbench 9.x Hosts
  • If/when Workbench and LFMT is deployed, both Workbench Agents 8.5 and 9.x would be needed on each remote host
    • The Workbench Agent 8.5 would be required for LFMT to collect log files from the remote hosts (e.g., sip, urs, gvp, etc.)
    • The Workbench Agent 9.x would be required for Workbench ingestion of data from the remote hosts (e.g., sip, urs, gvp, etc.)
  • Workbench Agent Remote (WAR) 9.x is ONLY deployed on remote Genesys Hosts such as e.g., sip, urs, gvp, etc. - this components sends Metric data to the Workbench 9.x Server/Cluster

Workbench Version Alignment

  • Workbench Versions on all Nodes and at all Data-Centers should be running the same release (e.g., do not mix 9.0.000.00 with 9.1.000.00.).

ZooKeeper authentication provides improved security for the back-end Workbench storage, essentially requiring a username and password to access the ZooKeeper data.

ZooKeeper authentication is not enabled by default and can be enabled through the Workbench UI post installation.

ZooKeeper handles authentication / authorization by using ACLs to specify permissions on each ZooKeeper node. Once authentication is enabled, the nodes that already exist in Zookeeper will be associated with the new user. After that, any new configuration data that is saved in ZooKeeper will be associated with the new user. In this way, only the owner can access data saved in Zookeeper and no other user can view or edit it. Disabling authentication again will disassociate the Zookeeper user from all existing data nodes and allow any user to view or edit data saved in Zookeeper.

In case a cluster of ZooKeeper nodes is desired for fault tolerance and high availability, additional nodes can be installed. If authentication has been enabled in ZooKeeper prior to installing the additional nodes, this must be first disabled. After disabling authentication, proceed with installing the additional nodes. Once the additional nodes have been installed, ZooKeeper authentication can be reenabled.

Limitations and considerations

WARNING

  • Installing ZooKeeper Additional Nodes after enabling ZooKeeper Authentication is possible, but ZooKeeper Authentication should be disabled first.
    • After disabling authentication, the additional ZooKeeper nodes can be installed
    • Once the additional ZooKeeper nodes have been installed, ZooKeeper Authentication can be re-enabled
  • While the Zookeeper Authentication enable/disable process is running, some data may appear inconsistent if you navigate to other pages in the application; to avoid this, please wait until the notification Updating ZooKeeper Data is completed appears at the bottom of the page.
  • While the ZooKeeper Authentication enablement is in progress, it is recommended to not make any other Workbench configuration changes until the Updating ZooKeeper Data is completed toast pop-up is presented, which will be ~5 minutes.
  • For multi Workbench Data-Center (i.e. APAC and EMEA) deployments with Workbench Cluster (Primary, Node 2, Node 3), when enabling/changing Workbench ZooKeeper username and password, please ensure you're logged into the respective Workbench Data-Center before making the change
    • i.e. if you have 2 x Workbench Data-Centers (i.e. APAC and EMEA) with Workbench Cluster (Primary, Node 2, Node 3) at each Data-Center, and you wish to change the EMEA Workbench ZooKeeper username and password, please ensure you're logged into the EMEA Workbench and not the APAC Workbench

Currently Workbench supports TLS connections/communication between its Workbench IO Application(s).

For example a Workbench IO Application in APAC can communicate with a Workbench IO Application in EMEA, providing secure messaging of Alarm, Changes, Channel Monitoring and Auditing events across the WAN, to enable this Workbench IO "APAC" to Workbench IO "EMEA" connection/communication, the respective Workbench Host Objects must first be TLS Enabled.

NOTE

  • TLS connections to Workbench IO and Kibana (essentially the main Workbench UI) is currently NOT supported
  • TLS connections from Workbench IO Applications at different Data-Centers is supported
  • TLS connections to Elasticsearch has to be enabled when enabling Elasticsearch Authentication
  • TLS connections to ZooKeeper is NOT supported
  • TLS connection from Workbench to Engage Configuration Server is supported
  • TLS connection from Workbench to Engage Solution Control Server is supported
  • TLS connection from Workbench to Engage Message Server is supported

Enable TLS on the Workbench host

Only enable the Workbench Host TLS setting if/when Workbench IO Application TLS connection/communication is preferred between Workbench IO Applications at different Data-Centers (i.e. "APAC" and "EMEA") for improved security; complete this Workbench Host TLS enablement before enabling Workbench IO Application TLS or Workbench ElasticSearch Authentication is planned to be enabled; complete this Workbench Host TLS enablement before enabling ElasticSearch Authentication.

  1. Certificates need to be in a Java Key Store (.jks file) and accessible on the host by the user account running Workbench.
  2. Within Workbench, browse to the Configuration > Hosts section and select the host that TLS will be enabled on.
  3. Within the host object settings, navigate to the "2. Workbench TLS Communication" section.
  4. Populate the following options:
    • Keystore Path: path of the Java Key store on the host
    • Keystore Password: password for the key store
    • Truststore Path: path to the Java trust store
    • Truststore Password: password for the Java trust store
    • Protocol (default: TLSv1.2): TLS protocol that will be used
    • Algorithms: comma-delimited list of cipher suites that the host will use for TLS negotiation/communication with other nodes
    • Mutual-TLS: check to enable mutual TLS
  5. Click the save button to commit the changes.

Enable TLS in the IO application

Only enable the Workbench IO Application TLS setting if/when TLS connection/communication is preferred between Workbench IO Applications at different Data-Centers for improved security

  1. Ensure that the TLS properties have been first configured for the host object that the Workbench_IO application is running on (See the above Enable TLS on the Workbench host section).
  2. Within Workbench, browse to the Configuration > Applications section and select the Workbench_IO application in the list that TLS will be enabled on.
  3. With the Workbench_IO application object, navigate to the 9. Workbench Distributed Mode section.
  4. Check the TLS Enabled property.
  5. Click Save to commit the changes.
  6. Restart the Workbench_IO service for changes to take effect.

Enable TLS in the ElasticSearch application (only if enabling Elastic Authentication)

Only enable the ElasticSearch Application TLS setting if/when Workbench ElasticSearch Authentication is planned to be enabled.

NOTE: It is important to complete this ElasticSearch TLS enablement before enabling ElasticSearch Authentication

  1. Ensure that the TLS properties have been first configured for the host object that the ElasticSearch node is running on (see the Enable TLS on the Workbench host section).
  2. On the host in which the ElasticSearch node is running, place a copy of the key store and trust store in the following directory:
    • {WBInstallDirectory}/ElasticSearch/config
  3. Within Workbench, browse to the Configuration > Applicationssection and select the ElasticSearch application in the list that TLS will be enabled on.
  4. With the ElasticSearch application object, navigate to the 8.Workbench Elasticsearch Authentication section.
  5. Enable the authentication and specify the desired username and password.
  6. Click Save to commit the changes.

Workbench-to-Engage TLS

Workbench supports TLS connections to the following Genesys Framework components:

  • Configuration Server
  • Message Server
  • Solution Control Server

To setup/enable TLS for each of these components, please follow the Genesys Security guide at the following location to configure TLS:

Ensure that the certificates are installed on the Workbench Server host/VM to enable connectivity to the Framework components.

NOTE: For Windows VMs/Hosts ensure that the certificates are installed for both the user running the Workbench installation as well as the LOCAL_SYSTEM account that will be running the Workbench Services.

Once the framework components and the respective hosts/VMs have been configured to use TLS, the provisioned Workbench Server application in Configuration Server will also need to be configured with the TLS properties to connect to each of the Framework components.

Configuration server

During Workbench installation, when prompted to specify the Configuration Server details, make sure to specify the auto-upgrade port that is defined for the Configuration Server instance.

NOTE: If Workbench was originally installed using a non-secure port of Configuration Server, the following file can be updated within the Workbench installation directory to change the port to an auto-upgrade port:

  • {WbInstallDir}/karaf/etc/ConfigServerInstances.cfg


Within this file, update the port for the primary Configuration Server.  After the file is updated, restart the Workbench_IO to use the new Configuration Server settings.

Solution control server

  1. During Workbench installation you will be prompted to select the Solution Control Server instance the Workbench will connect to subscribe to framework events.
  2. From within Genesys Administrator or Genesys Administrator Extension (GAX), ensure that the provisioned Workbench Server application object has a connection to both the primary and backup (if applicable) Solution Control Server and that the secure port is selected when adding these connections.  Workbench will use this port when connecting to Solution Control Server.

Message server

  1. During Workbench installation you will be prompted to select the Message Server instance that Workbench will connect to subscribe to framework events.
  2. From within Genesys Administrator or Genesys Administrator Extension (GAX), ensure that the provisioned Workbench Server application object has a connection to the primary and backup (if applicable) Message Servers and that the secure port is selected when configuring these connections.  Workbench will use this secure port when connecting to Message Server.

Windows

Stop the Workbench Services in this order

  • Genesys Workbench.IO 9.x.xxx.xx
  • Genesys Workbench Kibana 9.x.xxx.xx
  • Genesys Workbench Metricbeat 9.x.xxx.xx
  • Genesys Workbench Elasticsearch 9.x.xxx.xx
  • Genesys Workbench ZooKeeper 9.x.xxx.xx
  • Genesys Workbench Agent 9.x.xxx.xx
  • Genesys Workbench Logstash 9.x.xxx.xx
  • Genesys Workbench Heartbeat 9.x.xxx.xx

Start the Workbench Services in this order

  • Genesys Workbench.IO 9.x.xxx.xx
  • Genesys Workbench Elasticsearch 9.x.xxx.xx
  • Genesys Workbench ZooKeeper 9.x.xxx.xx
  • Genesys Workbench Kibana 9.x.xxx.xx
  • Genesys Workbench Logstash 9.x.xxx.xx
  • Genesys Workbench Metricbeat 9.x.xxx.xx
  • Genesys Workbench Agent 9.x.xxx.xx
  • Genesys Workbench Heartbeat 9.x.xxx.xx

Linux

Stop the Workbench Services in this order

  • WB_IO_9.x.xxx.xx
  • WB_Kibana_9.x.xxx.xx
  • WB_Metricbeat_9.x.xxx.xx
  • WB_Elasticsearch_9.x.xxx.xx
  • WB_ZooKeeper_9.x.xxx.xx
  • WB_Agent_9.x.xxx.xx
  • WB_Logstash_9.x.xxx.xx
  • WB_Heartbeat_9.x.xxx.xx

Start the Workbench Services in this order

  • WB_IO_9.x.xxx.xx
  • WB_Elasticsearch_9.x.xxx.xx
  • WB_ZooKeeper_9.x.xxx.xx
  • WB_Kibana_9.x.xxx.xx
  • WB_Logstash_9.x.xxx.xx
  • WB_Metricbeat_9.x.xxx.xx
  • WB_Agent_9.x.xxx.xx
  • WB_Heartbeat_9.x.xxx.xx

The Workbench Alarm is a dedicated console that displays a real-time statistics summary of active alarms, as well as a real-time data-table of active and historic alarms.

The statistics summary displays Total, Critical, Major and Minor metrics for:

  • All Source Active Alarms - from Workbench and Genesys Engage
  • Workbench Active Alarms - from only Workbench
  • Genesys Engage Active Alarms - from only Genesys Engage

The real time data-table displays the below listed details of all alarms, be those active or closed. Every column is provided with a sorting/searching option based on its data type, which makes the alarm identification much easier.

The different data information of an alarm is segregated as columns in the data-table.

  • Generated - The date and time of an alarm generation.
    • NOTE: Timestamps are stored in UTC and translated to local time based on the Users Browser Time-Zone
  • Status - Indicates if the alarm event status is Active/Closed.
  • Severity - Denotes the severity of the alarm event. It can be Critical, Major or Minor.
  • Alarm Message - The message about the alarm event in text format.
  • Host - The name of the Host/Server associated to the alarm event.
  • Application - The name of the application associated to the alarm event.
  • Data-Center - The name of the Data-Center associated to the alarm (Workbench only not Engage) event.
  • Sent to RAM Service - The date and time by when the alarm event was sent to the Genesys Remote Alarm Monitoring (RAM) Service.
  • Expiration - The time (in seconds) by when the alarm event will automatically expire/clear.
  • Cleared - The date and time at when the alarm event was cleared.
  • ID - The internal ID of the alarm event.

The real time data-table is also equipped with the following buttons for easy sort, filter and export options.

  • Show only Active Alarms - A filter to show only the active alarms available
  • Export - Gives the option to export the data-table in either PDF or Excel format
  • Column Visibility - Gives the option to show/hide the columns that you prefer.
  • Normal/Full-Screen - To toggle between the normal and full screen mode.
  • Column Reordering - Allows to move columns left or right within the data-table.
  • Column Search/Filter - Filter data-table events based on Date & Time, drop-down filter or text searches
  • Column Sort - Generated and Sent to RAM Service

An example Workbench Alarm Console shown below:

Alarm Console and Workbench Data-Center Synching

WARNING: Post a Workbench Data-Center sync, only Active Alarms will be synced; Engage Alarms are not synched because each Workbench Data-Center IO component has it's own integration to the Engage Solution Control Server (SCS) component and therefore synching is not required.

By default, the Start Page is set to the Home Dashboard with the following information:

  • Workbench Status Summary
  • Workbench Hosts Status Summary
  • Workbench Application Summary
  • Wokrbench Agent Status Summary
  • Workbench to Genesys Engage Integration Summary
  • Workbench Channel Monitoring Status Summary
  • Workbench Data-Center Summary
  • Workbench Remote Alarm Monitoring (RAM) Status Summary
  • Workbench General Information Summary

Start page options

Workbench enables users to configure their Start Page via the User Preferences navigation bar option.

Here you can select and configured the following options:

  • Home Dashboard
  • Dashboards
  • Alarms
  • Changes
  • Channel Monitoring
  • Discover
  • Visualize
  • Configuration

Workbench IO

This component ingests data from multiple data sources such as Genesys Engage Configuration Server (CS), Genesys Engage Solution Control Server (SCS), Genesys Engage Message Server (MS) enabling the user to visualise health, status (via Dashboards, Visualizations, Health-Maps, Alarms/Changes Consoles) and troubleshoot their Genesys platform.

Workbench Agent (WB Hosts)

This component is installed on each and every Workbench host where Workbench components are installed. The WBAgent in 9.0 is used for deployment, configuration, status and control of the Workbench components.

Workbench Agent Remote (non WB Hosts)

This component is installed on each Engage (i.e. non Workbench host) where you wish to send metric events to the Workbench node/Cluster; this then enables observability of host and process CPU, Memory, Disk and Network metric data, providing rich insights and analysis capability into host and process metric utilization, performance and trends.

Workbench Kibana

This component is the Workbench Client, providing the Workbench UI where users can leverage dedicated Alarms, Changes, Audit and Discover Consoles, Channel Monitoring Call Flows, Dashboards and Visualizations, Health-Maps etc to monitor and troubleshoot their Genesys Engage platform.

Workbench Elasticsearch

This component is the data event storage feature of Workbench providing a full-text search engine. Alarm, Configuration Change, Channel Monitoring event, Auditing event and Metric event data are all stored within Workbench Elasticsearch.

Workbench Logstash

This component is a server side ETL data processing pipeline that enables data collection (from a variety of sources i.e. Workbench Agent, Workbench Heartbeat and Workbench Elasticsearch), data transformation and subsequent destination storage (i.e. Workbench Elasticsearch).

Workbench Heartbeat

This component is used for Workbench component health and status monitoring

Workbench Metricbeat

This component is used for Metric (i.e. Cpu, Memory, Disk, Network) data collection from Workbench and Genesys Application Servers (i.e. SIP, URS, GVP etc).

Workbench ZooKeeper

This component provides and stores Workbench configuration data such as Hosts, Applications, Channel Monitoring configuration, User Preferences etc.

Workbench Agent and Workbench Agent Remote

  • Workbench Agent 8.5 is ONLY for LFMT
  • Workbench Agent 9.x is ONLY for Workbench 9.x Hosts
  • If/when Workbench and LFMT is deployed, both Workbench Agents 8.5 and 9.x would be needed on each remote host
    • The Workbench Agent 8.5 would be required for LFMT to collect log files from the remote hosts (i.e. sip, urs, gvp etc)
    • The Workbench Agent 9.x would be required for Workbench ingestion of data from the remote hosts (i.e. sip, urs, gvp etc)
  • Workbench Agent Remote (WAR) 9.x is ONLY deployed on remote Genesys Hosts such as SIP, URS, GVP etc - this components sends Metric data to the Workbench 9.x Server/Cluster

Elastic Stack

Details of the Elastic stack components that are leveraged by Workbench 9.x can be found at: 
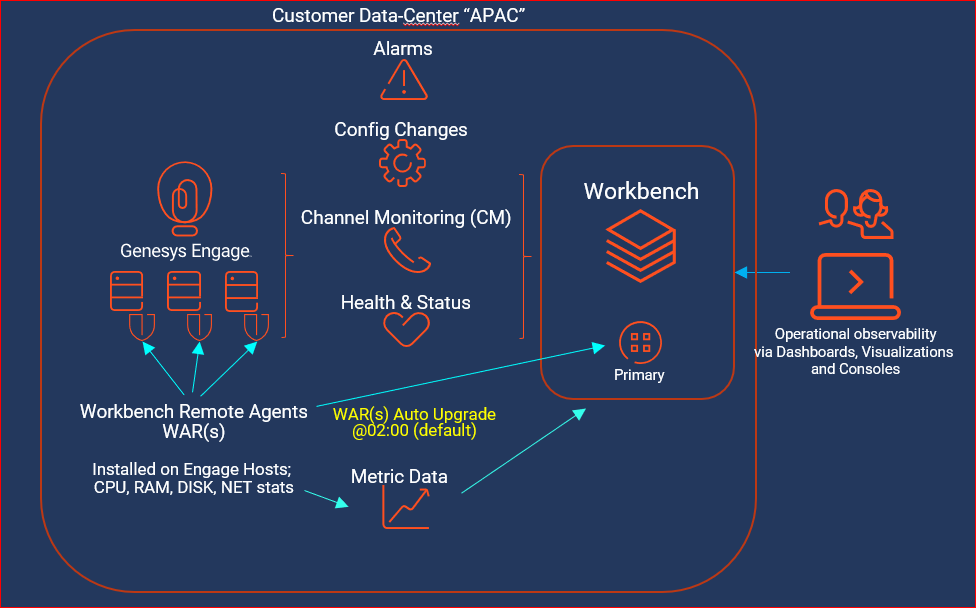
NOTE

  • If any Workbench data is required for archival purposes, please ensure it is saved at a separate location prior to running the Workbench uninstall script(s).
  • The Workbench uninstall process permanently removes the Workbench Services associated with all the Workbench components and all files, including data and logs, etc.
  • The uninstall process will leave the original configuration file used to generate the Workbench installation; if needed, this can be provided to Genesys Customer Care if related to an installation issue.
  • The Workbench uninstallation should be done in reverse Workbench installation order.
    • If permanently removing Workbench and you no longer wish to use Workbench.
      • uninstall any Workbench Agents running on remote Genesys Application Servers (i.e. SIP, URS, FWK etc).
    • Uninstall any Workbench Additional nodes.
    • Uninstall the Workbench Primary node.

Windows

  1. Browse to the Workbench home installation folder (i.e. "C:\Program Files\Workbench_9.x.xxx.xx").
  2. Open a Command/Powershell Console as an Administrator.
  3. Run uninstall.bat file.
  4. Remove any remaining files/folders from and including the Workbench "Home" installation folder.
  5. This completes the Workbench Linux uninstall process.

Linux

  1. Via a Linux Terminal, cd (Change Directory) to where Workbench is installed (i.e. /opt/Genesys/Workbench_9.x.xxx.xx).
  2. Run ./uninstall.sh as a User with Administrator permissions - not as "root".
  3. Remove any remaining files/folders from and including the Workbench "Home" installation folder.
  4. This completes the Workbench Linux uninstall process.

Workbench Dashboards are a placeholder for a collection of Visualizations that display health, status and event data.

Workbench Dashboards provide at-a-glance insights into data that has been ingested from your Engage platform as well as Workbench related data and events.

To view Dashboards, click Dashboards on the navigation bar; post installation Dashboards (11) contain shipped examples to view and use, detailed below:

With Dashboards you can:

  • Create new Dashboards
  • Search for Dashboards
  • Share Dashboards
  • Clone/Copy Dashboards
  • Edit/Customize Dashboards
  • Full-Screen Dashboards
  • Arrange Visualizations within the Dashboards.
  • Gain monitoring and troubleshooting insights from the shipped Dashboards and newly created Dashboards.
  • Use and learn from shipped example Dashboards.
  • View the shipped Visualizations within the shipped Dashboards.

Genesys Home Dashboard

Workbench ships with a Genesys Home Dashboard; this Dashboard contains several shipped Visualizations providing key information such as:

  • Workbench Status Summary
  • Workbench Agent Status
  • Workbench to Genesys Engage Integration Status
  • Workbench Data Centers
  • Workbench Remote Alarm Monitoring Status
  • Workbench General Settings

Metrics Overview Example Dashboard

Workbench 9.1 adds a Metric data ingestion feature that enables observability of host and process CPU, Memory, Disk and Network metric data, providing rich insights and analysis capability into host and process metric utilization, performance and trends.

NOTE: Workbench Dashboards and Visualizations leverage the Elastic Kibana component, please review Kibana documentation for further detailed guidance.

  1. Once Workbench has been successfully installed, go to:
    • http://<Enter WB_HOST here>:8181
  2. At the Welcome to Workbench prompt, enter your Engage Configuration Server credentials.
         
  3. You will be presented with the Workbench Home Dashboard by default. You can change this in User Preferences.

The serial number of an Edge is a series of letters and numbers that is unique to each specific Edge that is manufactured and sold. The format for these serial numbers vary based on the version of the Edge.

Examples: MXQ81707DB, CCP103327446019008, ACG8003495.

Serial numbers are available on the physical Edge hardware itself, in the PureCloud UI, and in Supportability.

Using the Edge UI

  1. Go to Admin > Telephony > Edges > <Edge Name>.

Using Supportability

  1. Go to the Edges tab.

The PureCloud Edge is a server that makes telephony possible with PureCloud.

It handles SIP, Media (RTP), Architect call flows, and other related services to accomplish this.

The mobile application enables entitled users to view and update cases opened with Product Support, receive push notifications on personal, company, and account level case updates. Additionally, the user can opt for notifications on alarms and cloud incidents notification. 

With the help of Chat functionality, the user can directly interact with the Case Owner or any available analyst in real-time or make voice calls to the case owner. 

  1. Download the app from your preferred store (  App Store for iOS,  Play Store for Android.). 
  2. Once the installation is complete, open  Genesys Care 2.0
  3. Accept all prompts. 
    • NOTE: There may be prompts to allow the app to access the biometric authentication methods of your device (e.g., face scan, fingerprint, device passcode, etc.). Approve these requests as desired. 
  4. Enter your My Support credentials. 
  5. Enable the I accept the Terms & Conditions option. 
  6. Tap Sign In
  7. Once you are signed in successfully, you have access to: 
    • Cases 
    • Favorites 
    • Alarm Monitoring 
    • Notification Inbox 
    • FAQs (Frequently Asked Questions) 
    • Feedback & Support 
    • Contact Us 

Genesys has a strict Privacy Policy that applies to the mobile app. The mobile app has an idle timeout of 10 min, or if the app is terminated, and you must enter your credentials on next use.

NOTE

  • You must accept the terms and conditions to login to the app.
  • You can also view the Terms and Conditions by clicking on the link.
  • The sign-in button will be enabled ONLY if you accept the Terms and Conditions.

In addition to the Mobile App Terms and Conditions, the Genesys Care Tools Terms and Conditions also apply.


Once you have downloaded the app, you can adjust app-level settings by going to Application Menu > Settings.

General

  • Name – Displays the User’s name. Non-Editable.
  • Email Address – Displays User’s email address. Non-Editable.
  • Time zone - Displays User's Time zone. Non-Editable. This time zone value is obtained from Salesforce. All the date time values within the application such in Case Details, Alarm and Notification Inbox Screen will be displayed based on this time zone value. User needs to contact our Customer Care in order to update this time zone value.
  • Authentication
  • Enable Biometric Authentication - Option to enable/disable biometric authentication for the application. On switching the toggle button to ON state, the registration flow like the one described in Biometric Authentication section takes place. On successful verification, biometric authentication will be enabled for the application.
  • Set My Cases - Option to make My Cases as default landing screen in All Cases tab

Notifications

  • Case notification – Option to enable/disable notification for any case updates happening to the user created cases of external users and user owned cases of internal users.
  • Alarm notification – Option to enable/disable notification for any new alarms arising in user’s environment based on user’s preference. On enabling the alarm notification toggle, pop up with options like the alarm filter will be shown.
    • Alarm Severity - All, Critical, Major and Minor
    • Disable Origin - List of Origins
  • Maintenance Alerts - Option to enable/disable notification for maintenance related alerts from JIRA.

About

  • App Version – Application current version detail

Applicable Product Lines: Genesys CX, Multicloud CX, Engage On-Premise, PureConnect Cloud, PureConnect On-Premises

The Genesys Care Mobile Application 2.0 is intended to help you interact with Genesys more quickly and efficiently.

Using your mobile device, you can:

  • Review your Open Cases (Support and Admin), including all public Case Updates
  • Post updates to your Cases
  • Contact any of our regional Product Support Centers
  • Chat with the Owner of your Support Case (or an available Analyst, if the Case Owner is unavailable) - (Genesys Engage Premise and Genesys Engage Cloud only)
  • Request for Escalation and Case Closure
  • View Alarms in your environment (Requires Remote Alarm Monitoring - Genesys Engage Premise only)
  • Subscribe for Notifications on your Company's Cases (Critical or High), new Escalations or Cloud Incidents (Genesys Engage Cloud)
  • Review Notifications received in the past 3 days
  • Select Favorites on an Account or Case for easy follow-up or Notification actions

NOTE: Please note that the Mobile App is only available to Customers and Partners that have My Support Designated Contact or Read-Only access.

Home screen

Once you have successfully logged in, you will be directed to the Home Screen of the app. The home screen paves way for faster navigation to go to cases, favorite cases or Accounts, Alarms of your environment or Notification Inbox.

NOTE:  Alarm Monitoring function is only available to On-Premise Remote Alarm Monitoring subscribers.

Users can use the Floating Search button specified on the bottom of the Home page to search for Accounts and Cases. This provides a global search option for searching accounts with the account name and case with case #. Users can search for Open Cases, Closed Cases and Accounts. This search by default returns result for the past 1 year. Users can modify the date range filter to search for cases based on the created date from previous years.

Once the search results are listed, the users can click on the list item to view the case details for a case or case list for an account. This search option will be available across the application.

Overview

NOTE: Chat is only available for Genesys Engage on-premises and Genesys Cloud. You must be a Designated Contact to use the chat feature.

Chat gives Designated Contacts an additional option of engagement with the assigned Case Owner (or an available agent, if the case owner is unavailable) regarding the status of their Genesys Engage on-premises & Pure Engage Cloud Support cases. Chat is for case facilitation (quick questions or status updates) and not for live troubleshooting.

NOTE

Product Support assigns Case Owners based on product knowledge that is available globally. You may have a Case Owner that is in a different time zone than you. In this instance, live Chat for that Case might not be available during your local business hours. In such situations, the chat will then be routed to an available agent. If both the case owner and the agents are unavailable, then after queuing for 60 seconds the chat window will present an option to leave a contact phone number. This number will be saved to the case, for the case owner to contact you. Management will also receive an email alert to inform them of the same. The contact number will also be included in the email alert.

  1. Open any open case.
  2. Navigate to the expand icon at the bottom of the screen and click the Chat icon to begin.
  3. At the Starting a chat prompt. tap Proceed.
  4. The chat window will automatically start loading. 
  5. If the case owner is available, you can directly begin the chat session. 
  6. If the case owner is not available, then the chat will be routed to an available agent.
  7. If both the Case Owner and the other agents are unavailable, you can leave a contact phone number for follow-up. 
  8. Once you have finished, end your session by tapping End Chat.
  9. After you end the chat, a transcript of the session will be emailed to you.

NOTE: You must be a Designated Contact to subscribe to this feature.

This feature allows you to subscribe for the following notifications:

  • Case Update Notification for an Individual Case
  • Case Update Notification for all Personal Cases
  • Case Update Notification for all the cases of a particular Account (Account Notification)
  • Cloud Incident Notification

Case update notifications

Individual cases

You can subscribe to receive update notifications of an individual case from the Case Details screen. Once subscribed they will receive notifications whenever there is an update to that case.

  1. Open the Case Details screen of the case for which you want to receive notifications.
  2. Tap to toggle the Enable Notification switch to the On position.
  3. To disable notifications, tap the Enable Notification to the Off position.

Personal cases

You can subscribe to receive update notifications of all their personal cases from the App Settings Screen. Once subscribed, you will receive notifications whenever there is an update to any of your personal cases.

  1. In the Notification section of  Settings, tap the Enable Personal Notifications toggle to the On position.
  2. To disable notifications, tap the Enable Personal Notifications to the Off position.

Account notifications

You can subscribe to receive update notifications for all the company cases of an account through the Accounts screen.

  1. Search for an account and mark it as favorite (optional).
  2. On the top right corner of the account screen, tap Settings > Enroll Notification.
  3. Tap the Account Push Notification toggle to the On position.
  4. Select the categories for which you would like to receive notifications:
    • New Escalations - Receive notifications if there are any escalation to the existing cases
    • New Critical Cases - Receive notifications if there are new critical cases created for this account
    • New High Cases - Receive notifications if there are new high cases created for this account
  5. Tap Apply.
  6. You will start receiving notifications from the app if any of the above conditions are met. 

Cloud incident notifications

You can subscribe to receive update notifications for Cloud Incidents for the cloud accounts that you have.

  1. Search for an account and mark it as favorite (optional).
  2. On the top right corner of the account screen, tap Settings.
  3. Click the toggle Cloud Incident Notifications to the On position.
  4. On enabling account notification users will be able to receive the notification when a Cloud Incident is created in Service Now for that account.
  5. To disable notifications, tap the Cloud Incident Notifications to the Off position.
    • NOTE: The Cloud Incident toggle will be enabled ONLY if there is cloud deployment for the account. For the users having only premise accounts, the Cloud Incident notification toggle button with be disabled.

  1. You can share the case info by tapping the Share button at the top right of a case.
  2. At the Share prompt, select the app with which you want to share the information.
    Case Share Option.png
  3. Once shared on clicking the link, it opens the application and will redirect you to the particular case details screen of the shared case.
  4. If you do not have the selected app installed in you device, you will be redirected to the  Play Store (Android) or  App Store (iOS) to download and install it.

If you are an on-premises user and have Remote Alarm Monitoring with Workbench, you will be able to access the Alarms and Alarm Notifications feature. You can view alarms and also set up alarm notifications.

Alarms screen

The Alarms list will populate based on a default view of all alarms by date received (descending order with most recent first). From the list, you will see a summary of key alarm information such as Alarm Severity, Server, App Name, Modified Date/Time, Description and Status.

  1. Select Alarm Monitoring from Application Menu on the Home screen.

Customize the alarms list view

You can also choose to customize the list of alarms that you wish to see on the List screen. The screen comes along with filtering option to filter the alarms based on various categories such as,

  • Alarm Type – All/Active/Closed
  • Alarm Severity – Critical/Major/Minor
  • Time Interval – Start Time; End Time
  • Disable Origin – List of server origins

You can view the filters by selecting the menu icon in the top right corner or by swiping left from the Cases tab. Once selected and applied, you can use the Reset filter option to reset the alarm filters.

Alarm details

  1. Tap on the alarm on the alarms list screen to view the details of that specific alarm.
  2. The alarm details will be populated as an expanded ribbon.

Alarm notifications

Included with Remote Alarm Monitoring with Workbench is the benefit of receiving alarm notifications.

  1. Go to ≡ Menu > Settings > .
  2. In the Notifications section, set the Alarm Notifications to the desired position.
  3. At the prompt, you can also select which alarm severities to be notified about.
  4. Tap Submit.

Multiview alarm lists

If you are a Genesys Partner or Internal User managing more than one end user with Remote Alarm Monitoring, you can view all your customers and their active alarms.

The Alarms screen will not have a list but will have a search option.

  1. Search for the account for which the alarms need to be displayed.
  2. Select the account and you can view the list of alarms for the account.

When you select Cases from the Home Screen or ≡ Menu of the Genesys Care Mobile App, you will see a list of your non-closed cases, including cases opened by other Designated Contacts at your company, and be able to perform other functions.

The following are the different functions that you can perform from the Cases window.

Designated Contacts and case management

  1. From the Cases screen, Designated Contacts should select Show Only My Cases toggle to view cases they have opened.
    • By default, the list shows all the non-closed company cases.
  2. Once toggled, a popup will be shown to set the My Cases as default landing screen in All Cases tab.
    • If desired, you can opt for this and can be reverted via app Settings.
  3. You can select any case to view the case details including the case Severity Level, Case Number, Case Status, Account Name, Product Support Group, Last Modified Date and Sub-Status.
  4. The case list is populated in priority categories as Critical, High, Medium and Low.
  5. The cases that are in Awaiting Info and Solution Proposed status that exceeded 24 hours without response will be highlighted in order to denote that user needs to take some action on those cases.

Using the Case List screen

Filter your cases

  1. Tap  More options > Filter Cases.
  2. Select the filters desired.
  3. Tap Apply.
  4. To reset the filters, tap Clear Filters.
  5. If you are a Designated Contact, the case list view can include all non-closed cases that your company has opened for all the end users your firm represents.

Sort your cases

The Case List also comes with Sort option that sorts the cases based on Priority and Last Modified.

  1. Tap  More options > Sort By.
  2. Select the desired sorting option in the next menu. 

Favorites

If you want to access some cases frequently to stay on top of them, you can use the Favorites tab to add the cases that you want as favorites.

When the case or Account Name is searched in the search bar, you can favorite the case/account by clicking on the start button present on the right-hand side against the case/account name. When a Case is added to Favorites, the case notifications subscription will be enabled.

Once an account or case is marked as favorite, it will be displayed in the My Favorites section of Account/Cases tab. You can view the case list of Favorited account or case details of Favorited case by clicking on these cards. You can add as many as 20 favorites which includes both Accounts and Cases. If you want to add a new favorite and it has reached a limit of 20, then you must remove one of the existing favorites and then add the new one. The case subject will not be shown for the cases that are GDPR restricted for the user who logs in.

When a Case or an account is removed from Favorites, the case or account notifications subscribed will also be removed. A confirmation popup will be displayed to get the user input, as displayed below.

NOTE: You may see a prompt that No Favorites are Found. The Favorites tab is empty until you begin to favorite cases.

  1. Tap on the global search button and input the case number or the account you would like to favorite.
    • If you are the end user of the Genesys platform, then you can search for your company cases for which you have access to.
    • If you are a partner user, then you can search for an account or company cases for those you have access to.
  2. To add a Favorite, tap  Favorite.
  3. To remove a Favorite, tap  Remove, then tap Remove at the prompt to confirm.

Case details

You can view the details of a case by clicking on the case from the case list. The case list page contains details about the case along with the updates posted on the case. If you need more details on the case, you can click on the Expand (Downward arrow) icon to expand the details section. The bottom of the case details screen has an expandable menu indicated by a downward arrow. It has the below functionalities.

  • Post updates - Post updates to a case
  • Chat – Chat with the owner of the case or any available analyst if the owner is unavailable.
  • Escalation – Request to escalate a case for critical attention
  • Case Closure – Request to close a case.
  • Call - Redirects to the Genesys Contact Us page to choose the appropriate Toll Free numbers.

You can also opt to receive notification specifically on a case by Enabling Notification on the case details screen. Whenever there is an update happening, a notification will be sent to the app.

The email updates on the case updates section will be displayed only with the subject. For viewing the entire email updates, you need to select on More Info option. This will show the entire update in separate modal window.

As a part of General Data Protection Regulation (GPDR), the PII data of the EU/EEA customers will not be accessible by Genesys US personnel. When the Genesys US personnel access the Case details screen of EU/EEA customer, the below screen will be displayed to restrict the information. The case related functionalities like Post Update, Chat, Call, Escalation and Closure will not be available for access.

Overview

Your customer may ask you when their Edges will upgrade, why every Edge isn’t on the same version, how they can get their Edges updated early, or for planning for an upcoming call event. Maybe they’re running an ad campaign during March Madness and expect lots of calls, so they’re interested in scaling edges up in advance. Maybe they’re part of a vaccine rollout and expect high call volumes, or it’s their busy season. This should help you know how to guide these conversations.

Edge versions (model)

An Edge Version is what most people would think of as the model of the Edge, like iPhone 8 or 11 Pro, and so on. Customers can purchase physical edges (Standard V3, Edge Mini, Edge Micro), or can use Cloud (AWS) edges, if they’re not a BYOC-Prem customer, as we reviewed in our last post.

Edge builds (software)

An Edge Build is the software version that the Edge is running. Think of this like smartphones: your iPhone 12 and my iPhone 10 could both be running iOS version 14.4.2, even though our phone versions are different. The terms Edge Build and Software Version both refer to software that runs on the Edge to make it function. Software Version is the term used in the Genesys Cloud UI. However, Product Support, Development Support, Development, and Professional Services will most commonly use the term Edge Build. 

Build numbers

Edge builds are normally referred to by their build number, such as 9982, however, the full build number is 1.0.0.9982. When looking in the Genesys Cloud UI the full version will be displayed.

Build release dates

New builds are released about every two weeks, but there are times where releases take longer.

As Edge builds are released they are announced in the Genesys Cloud Release Notes, specifically the Edge and Media Tier release notes. Edge builds are released first for Manual Update then about a week later for Automatic Update. This is done to allow customers time to test builds before automatic updates if desired. This method also allows customers waiting for important fixes to obtain them earlier than they would via automatic updates.

Build updates

Customers with Physical Edges can do the manual updates on their own, but customers with Cloud Edges would need to open a case with Product Support for us to upgrade their Edges if they cannot wait for the automatic update to be deployed.

Locate the build of your Edge

There are two locations for your build information, depending on the type of Edge you have:

  1. Go to Admin > Edges to view the Software Version column.
                -----OR-----
  2. [LDM Edges only] Go to Admin > Edges> [Edge name} > General tab.

How to update your Edge build

Edges can be updated manually, or automatically. Automatic updates may not be disabled; however, customers can control the window of time in which updates are applied. Customers will ask about this timing, because they’re used to thinking about doing the upgrades themselves, and they want to plan for testing. Helping to reassure customers that this process is automated, and they can sleep peacefully is a huge advantage for having a cloud-based contact center.

Physical Edges

Customers can configure auto update settings from the Site an Edge is assigned to:

  • How often updates are checked for (daily or weekly)
  • The window of time when updates are checked (All day, or a 2+ hour window)
  • Time Zone used to determine the time. 

When an automatic update initiates, the Edge immediately launches a call draining process, which is designed to ensure that all existing active calls on the Edge are allowed to complete normally before the software update begins. During the call draining process, no new calls are allowed on the Edge. (Other Edges in the group continue to accept new calls.) Call draining has a 3-hour time limit. After 3 hours any active calls are dropped and the Edge would then update.

The number of Edges that can be updated automatically per day is limited on the Genesys side to protect the Genesys Cloud platform. This limit is per AWS region and applies to all Orgs in the same region. Because of this limit it may take several update cycles for all Edges in an Org to be upgraded. For this reason, Genesys Cloud suggests setting a daily update window, instead of a weekly window.

Cloud Edges

For Cloud Edges, the update window is between 12 AM and 5 AM daily.  If the customer needs to adjust this window, they should open a case with Product Support to have the window adjusted.  Cloud Edge updates work a bit differently, and new Edge instances are created in AWS. You may hear Product Support refer to this as “spinning up” new Edges. If a customer has 12 Cloud Edges, the upgrade process creates 12 brand new Edges in AWS, and gracefully migrates phone registrations to the new edges. As calls drain off of the old version, those Edges are removed from the environment. When the Edges are removed, this also means that the logs from those Edges are gone, which can sometimes frustrate customers.  Our Dev team is working on a way to capture the logs, but it’s not live yet.

Why migrate to the Cloud model? 

The Cloud-based Edge deployment model has enormous benefits over their On-Premises counterparts.

Dollars to donuts

  • There is no additional charge to using Cloud-based Edges. 
  • The customer’s call capacity can be easily increased to meet their business needs with no added capital expenditure. 
  • No co-location cost. 
  • No physical Edge devices to buy (or replace after the three-year warranty lapses). 

Simplified environment 

  • Network, VPN, and Firewall/Security configuration make up the most common Product Support issues seen by the Genesys Cloud Product Support Telephony team. Taking the Edge out of equation allows customer and partner network engineers to wholly eliminate that variable.  
  • Improved supportability for both customers and the Genesys teams. 

No physical maintenance needed 

  • Cloud-based Edges have a lifetime warranty and are replaced with a brand-new instance monthly! 
  • Never again experience downtime due to the need to replace a failed physical Edge device.  
  • Save time with reduced troubleshooting and removing RMA potential. 

Speed and High Availability (HA) connection 

  • Direct connection to the AWS global carrier-class backbone 
  • Genesys Cloud Product Support engineers have a direct connection to Cloud-based Edge logs, meaning a failed or slow ISP connection will no longer hinder the investigation of their issues. 

Scalability 

  • Cloud-based Edges automatically scale to meet short-term unexpected volume spikes. 
  • Cloud-based Edges can be pre-scaled to handle expected business needs such as holidays, marketing campaigns, etc... 

Enhanced security 

  • Every Cloud-based Edge instance exists within a single virtual machine (VM) that has a maximum lifespan of 30 days for security purposes, after which the device is decommissioned, and a new VM/Edge instance takes its place.  
  • Genesys Cloud updates the OS/Security patches on Cloud-based Edges every 30 days so things are always current. 

Customers can choose to remain with their current Carrier if they meet Genesys Cloud Carrier requirements or can opt to move to Genesys Cloud Voice. Some upcoming Genesys Cloud features will only be available to customers using Cloud-based Edges.

How to begin the process

Genesys considerations

  • Customers cannot complete the project on their own due to certain permissions and backend tools that are only available to Genesys personnel.  
  • It is a recipe for frustration to allow a customer to try to migrate on their own due to its complexity and dependency on multiple Genesys teams to coordinate their efforts.  
  • The customer’s account team will need to amend their subscription by adding either Genesys Cloud Voice or BYOC Cloud.  

Customer considerations

  • How will removing physical Edges affect the path data/audio needs to travel?  
  • Physical Edges allow local carrier connections at each location with an Edge.  
  • BYOC Cloud requires that all data/audio flow in and out of the AWS Region the Org is in. 
  • Is their current carrier compatible with BYOC Cloud
  • Will any numbers need to be ported as part of this migration? 
  • Are the stations used by agents compatible with BYOC Cloud? 
  • Phone Compatibility Matrix 
  • Should the customer consider Amazon Direct Connect as part of this migration? 
  • Does the customer understand the importance of a stable and quality internet connection when using GCV/BYOC Cloud? 
  • What is the customer's normal concurrent call volume? GCV and BYOC Cloud Orgs are configured for 400 concurrent calls by default. If the customer runs higher than this, they will need to have their Org scaled to accommodate. 
  • The customer will need to work with Professional Services on the plan for migrating between their BYOC Prem and BYOC Cloud deployment. Sites, number plans, locations, trunks, stations, etc., are all affected by migrations. Migrations without downtime also add complexity to this plan. 
  • Does the customer have any Architect flows that dip into other systems, and are those systems accessible through the public internet? 
  • Is the customer's Networking team ready for the firewall changes that will be required? 

The process itself

These are the typical steps of a Premises to Cloud-based Edge, and the parties that will be involved with each step. 

  1. The customer decides that they want to migrate to the Cloud.
  2. Customer engages with their partner/CSM so Genesys can create a new quote with the correct Product/Features. 
  3. The new quote is signed, returned to Genesys, reviewed by Order Management & Finance, then approved. 
  4. After the quote is approved an order is created, and the CCDB/Subscription tied to the customers Cloud Deployment is updated with this new Order. 
  5. Billing Automation steps in and adds any new products added from the quote  
  6. Billing Automation does NOT remove any old items; this happens later. 
  7. The PS (Professional Services) team carries out their migration, and then cuts over to the new deployment model.  
  8. This is a large step, and could takes days, weeks, or months depending on the complexity of the migration. 
  9. After the migration is complete and confirmed stable, Genesys Cloud Product Support comes in and removes old configuration, products, and features.  
  10. Steps for this stage vary depending on what deployment model is being removed.  

Overview

Biometric authentication allows you to use the biometric features of your mobile device as a method of login in place of the traditional email and password. 

Some biometric methods include: Fingerprint (Android), Facescan (Android), Face ID (iOS), Touch ID (iOS)

NOTE: You must have biometric authentication enabled and configured at the device before it will be available for the app.

Allow the app to use biometric authentication

After installing the app, you must allow the app-level access to biometric features of your device using the prompts.

  1. Open Genesys Care 2.0.
  2. At the prompt, tap OK (iOS), or scan your finger or face (Android).
  3. Once validated, you will be enrolled for biometric authentication at the app level.

Android Fingerprint example

iOS Face ID example

Toggle biometric authentication on or off

  1. Access  Settings within the app.
  2. Tap the toggle to the desired position.

PureEngage support information can be found on the Multicloud Docs site. 

To view all available content, please visit the Product Support page. 

If you are new to Multicloud or would like a visual guide on how to navigate My Support, including opening and managing cases, please review the My Support Info Guide for Cloud CX On-Premises or the My Support Info Guide for Cloud CX

If you are a partner, you can also log in to the Partner Portal to access documentation that requires login. 

PureConnect On-Premises customers and partners should visit the PureConnect Resource Center. If you need information on how to use My Support including opening and managing cases, please reference one of the applicable handbooks: Direct Customer Handbook, Partner Handbook, or Dedicated Support Services Guide

Cloud CX customers and partners should visit the Cloud CX Resource Center or log in to the Product & Support Information Site. If you need information on how to use My Support including opening and managing cases, please reference the Cloud Customer Guide


  1. Navigate to Configuration > Applications > WB Zookeeper > 6.Workbench Zookeeper Authentication.
  2. Configure the following fields:
    • Enabled: Click this checkbox to enable ZooKeeper Authentication.
    • Username: Provide an ZooKeeper Username (i.e. "WB_ZK") which be be used for the Authentication Username Credential.
    • Password: Provide an ZooKeeper Password (i.e. "my_p@ssword123") which be be used for the Authentication Username Credential.
      • NOTE: The password fields include an eye icon button that allows you to see the plain text when entering the password.
    • Confirm password: Provide the ZooKeeper Password (i.e. "my_p@ssword123") again to ensure accuracy.
      • NOTE: The password fields include an eye icon button that allows you to see the plain text when entering the password.
  3. Click Save.


Install instructions for additional nodes in Windows and Linux.

Windows

If Workbench data and configuration redundancy and service high availability is required, Genesys recommends a 3+ (3 minimum Multi/Cluster) Node/Host Workbench deployment.

WARNING

  • Before commencing these Workbench Additional Node instructions, ensure the Workbench Primary Node has been successfully installed
  • Workbench supports a 1 or N (minimum 3 with odd number increments) Node architecture
    • Deploying only a Workbench Primary and Workbench Node 2 architecture will cause future upgrade issues likely resulting in a reinstall of Workbench

Repeat these steps for any additional nodes desired.

  1. On the respective 2nd Workbench Additional Node/Host, extract the downloaded Workbench installation compressed zip file.
  2. Within the extracted folder, open a Command/Powershell Console As Administrator and run install.bat.
  3. Click Next on the Genesys Care Workbench 9.x screen.
  4. Review and if you agree click Accept on the Term's & Condition's screen.
  5. Select New Installation on the Workbench Installation Mode screen.
  6. Click Next.
  7. On the Workbench Installation Type screen, select Additional Node.
  8. If required, change from the default Default installation to Custom (complete the Custom config according to your needs).
  9. Click Next.
  10. On the Base Workbench Properties screen, provide the Workbench Home Location folder where Workbench components will be installed (i.e. " C:\Program Files\Workbench_9.1.000.00").
  11. Review the network Hostname - this should be accessible/resolvable within the domain.
  12. Click Next.
  13. On the Additional Components To Be Installed screen, ensure the Workbench Elasticsearch option is are checked (for HA of the ingested Workbench data ,e.g., Alarms, Changes, Channel Monitoring, etc.).
  14. Ensure the Workbench ZooKeeper option is checked (for HA of the Workbench configuration settings).
    • NOTE: Workbench ZooKeeper Cluster supports a maximum of 5 Nodes.
  15. If required, based on the Planning/Sizing exercise, ensure the Workbench Logstash option is checked.
  16. Workbench Agent is checked by default; it's a mandatory requirement for any hosts running Workbench 9.x components.
  17. Provide the Primary Node ZooKeeper IP and Port - i.e. 10.20.30.1:2181.
    • WARNING: Due to a Port validation limitation, please ensure the ZooKeeper Port is correct before pressing Enter; a race-condition could occur if not correctly entered.
  18. Click Next
  19. Click Next on the Service Account screen.
    • NOTE: Unless Network Account is required.
  20. Click Install.
  21. Click OK on the Finished dialog.
  22. Click Exit.

Checkpoint

NOTE

  • Based on the instructions above, within the Workbench Configuration\Hosts and Workbench Configuration\Applications menus there should now be additional Hosts and Applications
  • The number of additional workbench Hosts and Applications will vary based on your sizing architecture and the selections you made during the installation of additional components
  • Currently additional Workbench components have been installed on their respective Hosts, the next step is to form the Workbench Cluster which will provide HA of ingested event data (Workbench Elasticsearch) and HA of Workbench Configuration data (Workbench ZooKeeper).
  • Do not form the Workbench Cluster until all Workbench Additional Nodes have had their additional respective components installed

As an example, following the installation of Workbench Additional Node 2 and Node 3, the additional Hosts and Applications are highlighted below:

Hosts

WB 9.1 Addt Node Hosts2.png

Applications

WB 9.1 Addt Node Appls2.png

ZooKeeper cluster configuration

Workbench ZooKeeper Cluster supports a maximum of 5 Nodes.

WARNING

  • Before configuring the Workbench ZooKeeper Cluster, ensure ALL Workbench Additional Node components have been installed

NOTE

  • Before configuring the Workbench Cluster, ensure ALL Workbench Agent and Workbench ZooKeeper components are Up (Green)
  • For the Workbench ZooKeeper configuration, use IP Address:PORT and not Hostname:Port
  • Workbench ONLY supports ODD number of additional nodes (i.e. 1, 3, 5 etc) within a Workbench Cluster architecture
  • Ensure ALL "N" Workbench Additional Nodes are installed/configured before forming the final Workbench Cluster
  • Workbench does not support scaling post Workbench Cluster formation.
  • For example, if you form a 3 Node Workbench ZooKeeper Cluster, you cannot increase to a 5 Node ZooKeeper Cluster - as such please ensure your Workbench planning and sizing is accurate before completing your Workbench ZooKeeper Cluster formation, else a reinstall may be required
  1. Navigate to the Primary ZooKeeper application, i.e. EMEA : WB_ZooKeeper_Primary
    1. Expand Configuration Section 4.Cluster Configuration
    2. In the Node 1 field enter the Primary Workbench ZooKeeper Hostname <IPAddress>:2888:3888
    3. In the Node 2 field enter the Workbench Additional ZooKeeper Node 2 Hostname <IPAddress>:2888:3888
    4. In the Node 3 field enter the Workbench Additional ZooKeeper Node 3 Hostname <IPAddress>:2888:3888
    5. Click Save.

NOTE

  • Wait for 3 minutes and refresh (F5) the Chrome Browser
  • Workbench 9 should now have a Workbench ZooKeeper clustered environment providing HA of Workbench Configuration

Elasticsearch clusters

Configuration

WARNING

  • Before configuring the Workbench Elasticsearch Cluster, ensure ALL Workbench Additional Node components have been installed

NOTE

  • Before configuring the Workbench Cluster, ensure ALL Workbench Agent and Workbench Elasticsearch components are Up (Green)
  • Fully Qualified Domain Name (FQDN) is NOT supported - either use Hostname or IP Address and not FQDN
  • Workbench ONLY supports odd number of additional nodes (i.e. 1, 3, 5, 7, 9 etc) within a Cluster deployment
  • Ensure ALL "N" Additional Nodes are installed before forming the final Workbench Cluster
  • Workbench does not support scaling post Workbench Cluster formation
    • For example, if you form a 3 Node Workbench Elasticsearch Cluster, you cannot increase to a 5 Node Elasticsearch Cluster - as such please ensure your Workbench planning and sizing is accurate before completing your Workbench Elasticsearch Cluster formation, else a reinstall may be required
  1. Navigate to the Primary Elasticsearch application, i.e. EMEA : WB_Elasticsearch_Primary.
    1. Expand Configuration Section 6.Workbench Elasticsearch Discovery.
    2. In the Discovery Host(s) field enter the value from the associated Section 5 - [Workbench Elasticsearch Identifiers/Network Host] field of ALL Elasticsearch applications (i.e. WB-1,WB-2,WB-3).
    3. Click Save.

Test the health status of the cluster

There are three ways to check the health status of the Elasticsearch cluster.

NOTE

Where <WB-VM-X> is the Workbench PrimaryNode 2 or Node 3 Host.

Via the web

  1. In a Chrome Browser navigate to:
    • http://<WB-VM-X>:9200/_cluster/health?pretty

Via PowerShell curl

  1. Run the cmdlet:
    • curl -Uri "<WB-VM-X>:9200/_cluster/health?pretty"

Via Linux curl

  1. Execute:
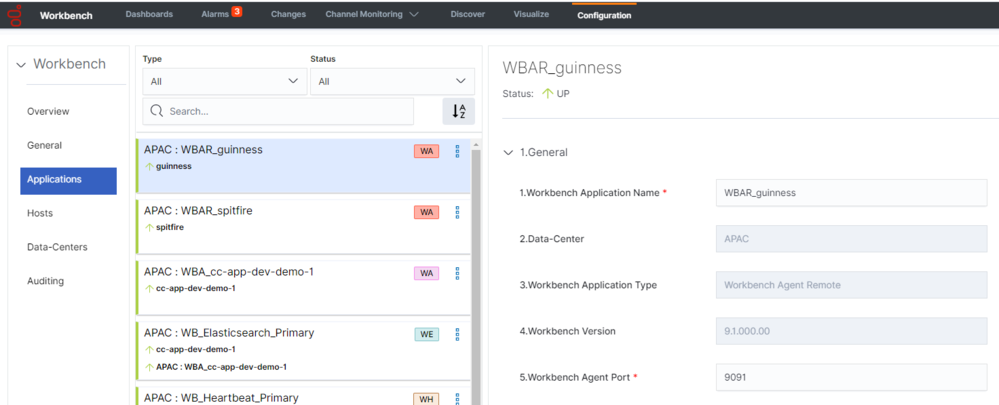
    • curl "http://<WB-VM-X>:9200/_cluster/health?pretty"

Expected output

Elasticsearch Cluster health should be reporting Green.

{

 "cluster_name" : "GEN-WB-Cluster",
 "status" : "green",
 "timed_out" : false,
 "number_of_nodes" : 3,
 "number_of_data_nodes" : 3,
 "active_primary_shards" : 29,
 "active_shards" : 58,
 "relocating_shards" : 0,
 "initializing_shards" : 0,
 "unassigned_shards" : 0,
 "delayed_unassigned_shards" : 0,
 "number_of_pending_tasks" : 0,
 "number_of_in_flight_fetch" : 0,
 "task_max_waiting_in_queue_millis" : 0,
 "active_shards_percent_as_number" : 100.0

}

Linux

Repeat these steps for any additional nodes desired.

  1. On the respective 2nd Workbench Additional Node/Host.
  2. Run tar zxf Workbench_9.x.xxx.xx_LINUX.tar.gz to extract the downloaded Workbench_9.x.xxx.xx_LINUX_Pkg.tar.gz compressed file.
  3. Navigate into the ip\linux folder.
  4. Run tar zxf Workbench_9.x.xxx.xx_Installer_Linux.tar.gz - to extract the Workbench_9.x.xxx.xx_linux.tar.gz compressed tar file.
  5. Run the command ./install.sh (DO NOT prefix ./install.sh with sudo).
  6. On the Genesys Care Workbench 9.x.
    1. Press Enter to continue.
  7. License Agreement.
    1. Press Enter to view the Term’s & Conditions.
  8. Review the Term’s & Conditions/License Agreement.
    1. Press Enter to scroll to the end.
    2. Or press N and Enter to review on a page-by-page basis.
    3. Press Enter (default=Y) to accept the T&C's/license agreement and continue with the installation if you agree to the T&C's.
  9. On the Installation Mode screen.
    1. Press Enter for New Installation (default).
  10. On the Installation Type screen.
    1. Press 2 and Enter for Additional Node.
  11. On the DEFAULT or CUSTOM screen.
    1. Press Enter to continue with the respective Workbench components Default settings (binaries/paths, config, ports, etc.).
    2. Or Press 2 and Enter to provide Custom settings (binaries/paths, config, ports, etc.).
  12. On the Base Workbench Properties - Workbench Home Location screen.
    1. Press Enter to accept the default installation path of /opt/Genesys/Workbench_9.x.xxx.xx.
    2. Or type the new installation path (i.e. /home/genesys/gcti/WB9.x.xxx.xx).
  13. On the Base Workbench Properties - Hostname screen.
    1. Review the Hostname automatically populated by the Workbench installer.
  14. On the Additional Components To Be Installed - - Workbench Elasticsearch screen.
    1. Press [y/Y] and Enter to install Workbench Elasticsearch on this host/node or Press Enter to skip (default) installation of this component.
  15. On the Additional Components To Be Installed - Workbench ZooKeeper screen.
    1. Press [y/Y] and Enter to install Workbench ZooKeeper on this host/node or Press Enter to skip (default) installation of this component.
  16. On the Additional Components To Be Installed - Workbench Logstash screen.
    1. Press [y/Y] and Enter to install Workbench Logstash on this host/node or Press Enter to skip (default) installation of this component.
  17. On the Additional Components To Be Installed - Workbench Primary ZooKeeper IP Address/Port screen.
    1. Type the Primary ZooKeeper IP:PORT (i.e. 10.20.30.40:2181) and press Enter.
  18. The Workbench Additional Node installation will now progress.
  19. The Workbench Additional Node installation is complete.

Checkpoint

NOTE

  • Based on the instructions above, within the Workbench Configuration\Hosts and Workbench Configuration\Applications menus there should now be additional Hosts and Applications
  • The number of additional Workbench Hosts and Applications will vary based on your sizing architecture and the selections you made during the installation of additional components
  • Currently additional Workbench components have been installed on their respective Hosts, the next step is to form the Workbench Cluster which will provide HA of ingested event data (Workbench Elasticsearch) and HA of Workbench Configuration data (Workbench ZooKeeper).
  • Do not form the Workbench Cluster until all Workbench Additional Nodes have had their additional respective components installed

As an example, following the installation of Workbench Additional Node 2, the additional Hosts and Applications are highlighted below:

Hosts

WB 9.1 Linux Addt Hosts.png

Applications

WB 9.1 Linux Addt Applications.png

ZooKeeper cluster configuration

WARNING

  • Before configuring the Workbench ZooKeeper Cluster, ensure ALL Workbench Additional Node components have been installed

NOTE

  • Before configuring the Workbench Cluster, ensure ALL Workbench Agent and Workbench ZooKeeper components are Up (Green)
  • For the Workbench ZooKeeper configuration, use IP Address:PORT and not Hostname:Port
  • Workbench ONLY supports ODD number of additional nodes (i.e. 1, 3, 5 etc) within a Workbench Cluster architecture
  • Ensure ALL "N" Workbench Additional Nodes are installed/configured before forming the final Workbench Cluster
  • Workbench does not support scaling post Workbench Cluster formation
    • For example, if you form a 3 Node Workbench ZooKeeper Cluster, you cannot increase to a 5 Node ZooKeeper Cluster - as such please ensure your Workbench planning and sizing is accurate before completing your Workbench ZooKeeper Cluster formation, else a reinstall may be required
  1. Navigate to the Primary ZooKeeper application, i.e. EMEA : WB_ZooKeeper_Primary.
    1. Expand Configuration Section 4.Cluster Configuration.
    2. In the Node 1 field enter the Primary Workbench ZooKeeper Hostname <IPAddress>:2888:3888.
    3. In the Node 2 field enter the Workbench Additional ZooKeeper Node 2 Hostname <IPAddress>:2888:3888.
    4. In the Node 3 field enter the Workbench Additional ZooKeeper Node 3 Hostname <IPAddress>:2888:3888.
    5. Click Save.

NOTE

  • Wait for 3 minutes and refresh (F5) the Chrome Browser
  • Workbench 9 should now have a Workbench ZooKeeper clustered environment providing HA of Workbench Configuration

An example Workbench Cluster Configuration being:

WB 9.1 Linux ZK Cluster Config2.png

WARNING

  • Workbench ZooKeeper Cluster supports a maximum of 5 Nodes

After clicking Save the ZooKeeper Cluster formation process will progress and complete:

WB 9.1 Linux ZK Cluster Config Complete.png

Elasticsearch cluster configuration

WARNING

  • Before configuring the Workbench Elasticsearch Cluster, ensure ALL Workbench Additional Node components have been installed

NOTE

  • Before configuring the Workbench Cluster, ensure ALL Workbench Agent and Workbench Elasticsearch components are Up (Green)
  • Fully Qualified Domain Name (FQDN) is NOT supported - either use Hostname or IP Address and not FQDN
  • Workbench ONLY supports odd number of additional nodes (i.e. 1, 3, 5, 7, 9 etc) within a Cluster deployment
  • Ensure ALL "N" Additional Nodes are installed before forming the final Workbench Cluster
  • Workbench does not support scaling post Workbench Cluster formation
    • For example, if you form a 3 Node Workbench Elasticsearch Cluster, you cannot increase to a 5 Node Elasticsearch Cluster - as such please ensure your Workbench planning and sizing is accurate before completing your Workbench Elasticsearch Cluster formation, else a reinstall may be required
  1. Navigate to the Primary Elasticsearch application, i.e. EMEA : WB_Elasticsearch_Primary
    1. Expand Configuration Section 6.Workbench Elasticsearch Discovery
    2. In the Discovery Host(s) field enter the value from the associated Section 5 - [Workbench Elasticsearch Identifiers/Network Host] field of ALL Elasticsearch applications (i.e. WB-1,WB-2,WB-3)
    3. Click Save

Example:

WB 9.1 Linux ES Cluster Config.png

Post clicking ''Save'' you will see the popup notification below:

WB 9.1 ZK Cluster Formation In Progress.png

NOTE

  • Logout of Workbench (Chrome Browser session)
  • Wait for a minimum of 6 minutes for the Workbench Elasticsearch Cluster formation to complete
  • Login to Workbench
  • Workbench 9 should now have a Workbench Elasticsearch Clustered environment providing HA of Workbench ingested event data

Test the health status of the cluster

There are three ways to check the health status of the Elasticsearch cluster.

NOTE

Where <WB-VM-X> is the Workbench PrimaryNode 2 or Node 3 Host.

Via the web

  1. In a Chrome Browser navigate to:
    • http://<WB-VM-X>:9200/_cluster/health?pretty

Via PowerShell curl

  1. Run the cmdlet:
    • curl -Uri "<WB-VM-X>:9200/_cluster/health?pretty"

Via Linux curl

  1. Execute:
    • curl "http://<WB-VM-X>:9200/_cluster/health?pretty"

Expected output

Elasticsearch Cluster health should be reporting Green.

{

 "cluster_name" : "GEN-WB-Cluster",
 "status" : "green",
 "timed_out" : false,
 "number_of_nodes" : 3,
 "number_of_data_nodes" : 3,
 "active_primary_shards" : 29,
 "active_shards" : 58,
 "relocating_shards" : 0,
 "initializing_shards" : 0,
 "unassigned_shards" : 0,
 "delayed_unassigned_shards" : 0,
 "number_of_pending_tasks" : 0,
 "number_of_in_flight_fetch" : 0,
 "task_max_waiting_in_queue_millis" : 0,
 "active_shards_percent_as_number" : 100.0

}

When Product Support receives a Workbench (WB) RAM alarm from the customers WB instance, the following process is actioned:

  1. The respective alarm (the supported subset of Genesys Engage alarms ingested by WB) is routed to Product Support and a case is opened by a Product Support analyst.
  2. The customer-provided Group Email will receive an email from Product Support informing you that an alarm case has been opened.
  3. The case will follow standard service level targets based on your Product Support contract.
  4. Only the Designated Contact can view, manage and close the support case via My Support; however, all members on the group email can provide case updates via email.
  5. An Alarm notification is sent to you via the Genesys Care Mobile App, if notifications are enabled.

Announcements